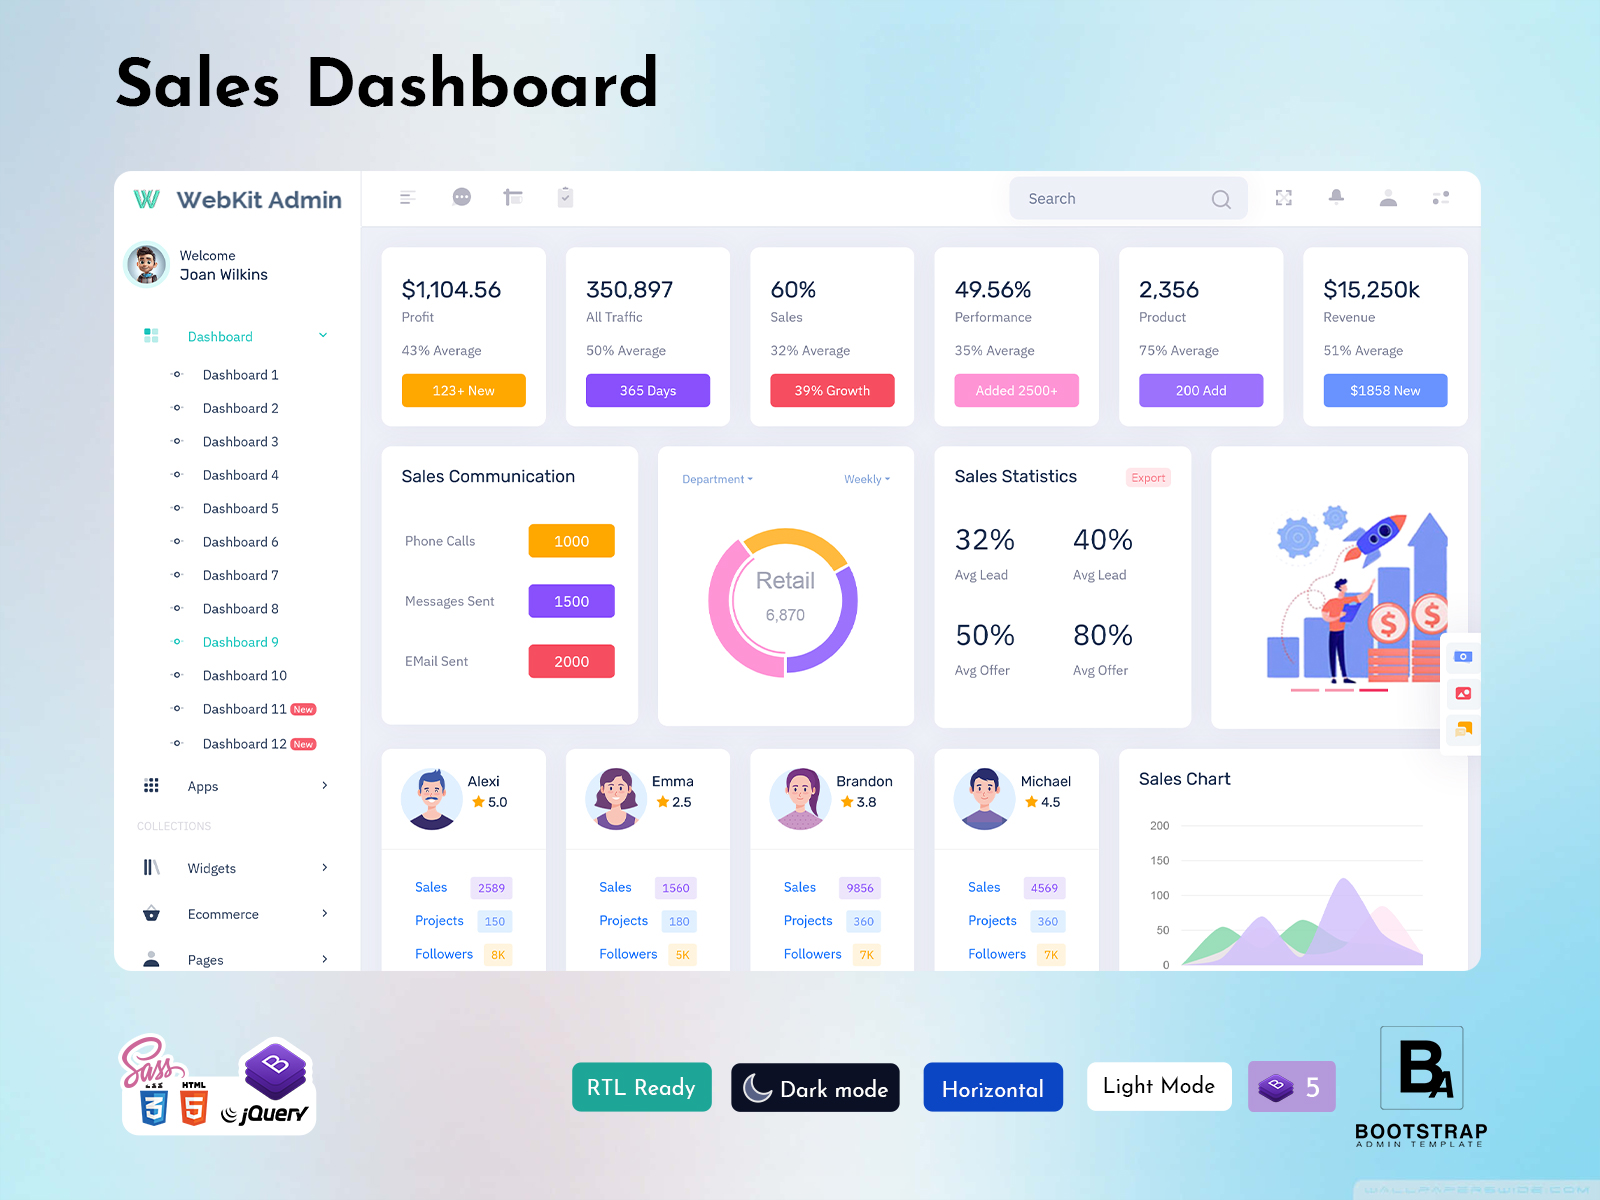
5 Must-Have Features of Sales Dashboard to Decode Sales Data
Are you drowning in sales figures? Does it feel hard to find actual insights? A Sales Dashboard can cut through the noise. It shows you key performance indicators (KPIs). You get a clear view of how your sales are doing. So, what makes a great Sales Dashboard?
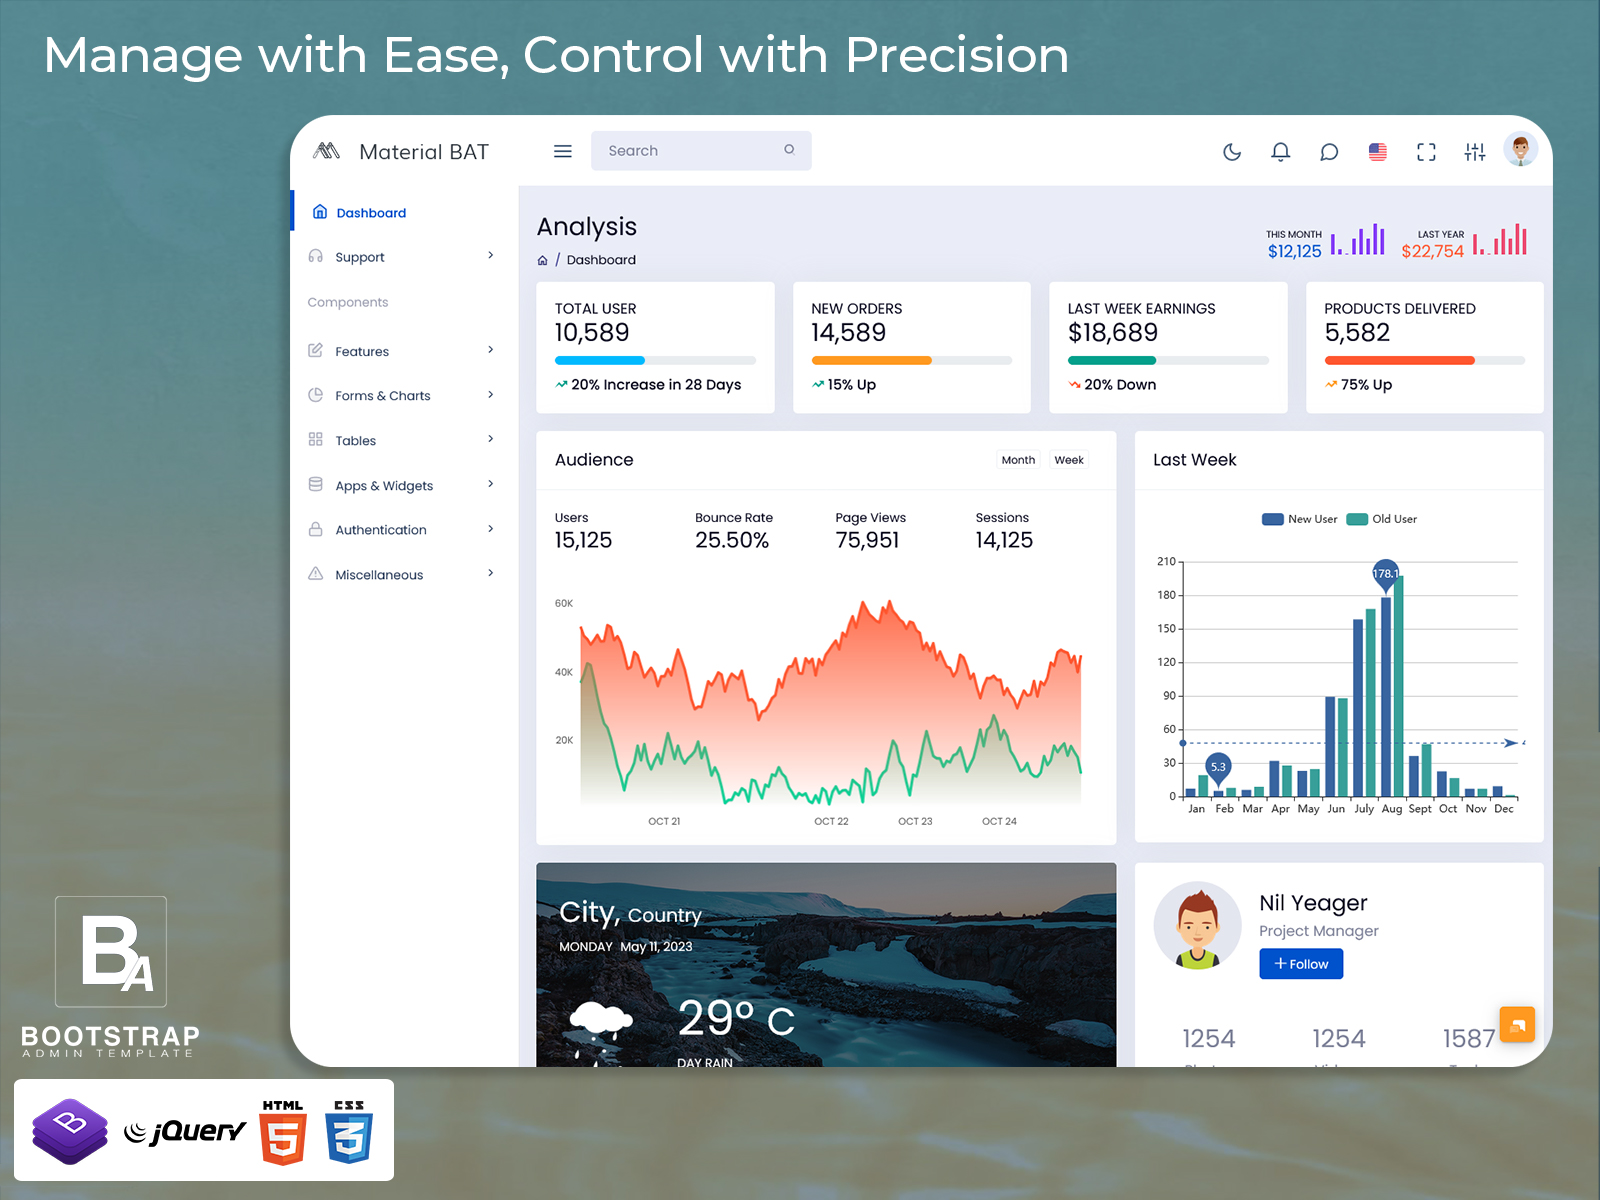
Dashboards of Alfa Admin Template
Admin Template Dashboard

MORE INFO / BUY NOW DEMO
Mailbox

MORE INFO / BUY NOW DEMO
Blog

MORE INFO / BUY NOW DEMO
Here are the 5 must-have features.
1. Real-Time Data Visualization
Why is real-time data crucial? It lets you make smart choices fast. You can stay ahead of your rivals in business. Real-time data visualization is a must-have in every Sales Dashboard.
Up-to-the-Minute Performance Tracking
Imagine knowing your sales numbers instantly. Real-time updates do just that. You see revenue, leads, and conversion rates as they happen. This way, you can tweak sales plans right away to boost performance. No more waiting for weekly reports!
Customizable Views
Everyone on your team is unique. So, their Sales Admin Dashboard views should be also. Sales reps might want to see different data than managers. Customizable dashboards allow it. You get the info that matters most to you. Personalize to see what you want.
Interactive Charts and Graphs
Data doesn’t have to be boring. Interactive charts and Analytical Charts bring it to life. Spot trends easily. Find patterns and outliers quickly. Click on a data point to learn more. It’s like exploring your sales data in 3D.
2. Key Performance Indicator (KPI) Tracking
What are KPIs, and why do they matter? KPIs are crucial for gauging sales success. They show you what’s working. You also see what’s not. KPI tracking is a core function of every Sales Dashboard.
Revenue and Sales Growth
Track the money coming in. Monitor your sales growth over time. These are essential financial KPIs. They show the big picture. Are you hitting your targets? Where can you improve? These metrics help you determine it.
Lead Generation and Conversion Rates
How well are you getting new leads? What rate are you converting those leads into customers? A Sales Dashboard lets you watch these efforts. Know your cost per lead to assess ROI.
Customer Acquisition Cost (CAC) and Customer Lifetime Value (CLTV)
CAC tells you how much it costs to gain a new customer. CLTV tells you how much revenue you’ll get from them during your relationship. Calculate and track these metrics. They show if your acquisition spending is worth it.
3. Sales Pipeline Management
Your sales pipeline is the path from lead to customer. Seeing it clearly is key. A Sales Dashboard helps find roadblocks. It also improves sales processes.
Stage-by-Stage Analysis
See where deals are in the Sales Admin Dashboard pipeline. Track prospecting, qualification, and closing stages. Find bottlenecks. Pinpoint areas for improvement. Focus on what’s causing issues.
Deal Forecasting
Want to know future sales revenue? Look at your current pipeline. Use the Analytical Dashboard to forecast your sales. Make predictions based on where deals stand. Accurate forecasting helps you plan.
Activity Tracking
Track what your sales reps are doing. See calls made, emails sent, and meetings held. Ensure they are actively engaging with prospects. Activity tracking boosts sales.
4. Goal Setting and Progress Monitoring
Dashboards aren’t just for watching data. You can set goals. Track progress. Motivate your sales team to hit targets. This turns data into action.
Individual and Team Goals
Set sales goals for everyone. Track progress as they work towards them. See who’s on track. Notice who needs help. Individual and team goals push performance.
Performance Benchmarking
Compare your numbers. See how you stack up against others. Look at industry averages. Review past performance. Find areas where you can get better.
Gamification Elements
Make sales fun! Use leaderboards and badges. Encourage healthy competition. Gamification motivates sales reps. It turns work into a game.
5. Integration and Accessibility
A Sales Dashboard is more useful when connected. It needs to talk to your other tools. It should be available anywhere. Integration and accessibility are vital.
CRM Integration
Connect your Sales Dashboard to your CRM. Use systems like Salesforce, HubSpot, or Zoho CRM. Automatically pull in data. Avoid manual data entry. Keep everything in sync.
Mobile Accessibility
Sales reps are often on the go. They need data at their fingertips. Your Smart Sales Admin Panel should be mobile-friendly. Access data on any device, anywhere.
API and Third-Party Integrations
Connect with other tools through APIs. Create a unified view of your data. Integrate with marketing automation platforms. Connect with accounting software. A connected Sales Dashboard is a powerful one.
Conclusion
So, what are the must-have features of a Sales Dashboard? You need real-time data visualization. KPI tracking is also crucial. Sales pipeline management is a must. Don’t forget goal setting and progress monitoring. Integration and accessibility ties it all together.
Use these features to decode your sales data. Boost your sales performance. Don’t wait, implement these features today. Unlock the full power of your data using a powerful Bootstrap Admin Template or Bootstrap 5 Admin Dashboard. Choose the right Bootstrap Admin HTML Template that includes Sales Dashboards and Analytical Charts to transform your sales process into a well-oiled machine.
Buy Now and Get Started Today!
Click below to purchase and start unlocking the full potential of your business!
BUY NOW