Dynamic Bootstrap Admin Template for Performance Evaluation
Running a successful business requires keeping track of important data to make informed decisions and stay competitive. Whether you’re managing a small team or overseeing a large enterprise, having the right tools to monitor key business metrics is crucial. That’s where the Bootstrap Admin Template comes into play.
This tool provides businesses with a central platform to manage and analyze essential data. It simplifies the process of tracking performance, making data-driven decisions, and optimizing strategies. In this article, we’ll explore the features of this easy-to-use dashboard and how it can help businesses of all sizes stay on top of their growth and success.
LTR Style Light Dashboard
style=”box-shadow: 1px 8px 29px 5px rgba(136, 136, 136, 0.82); margin: 0 auto; display: table”;”
MORE INFO / BUY NOW DEMO
Mail Page
MORE INFO / BUY NOW DEMO
Centralized Control Panel for Easy Access
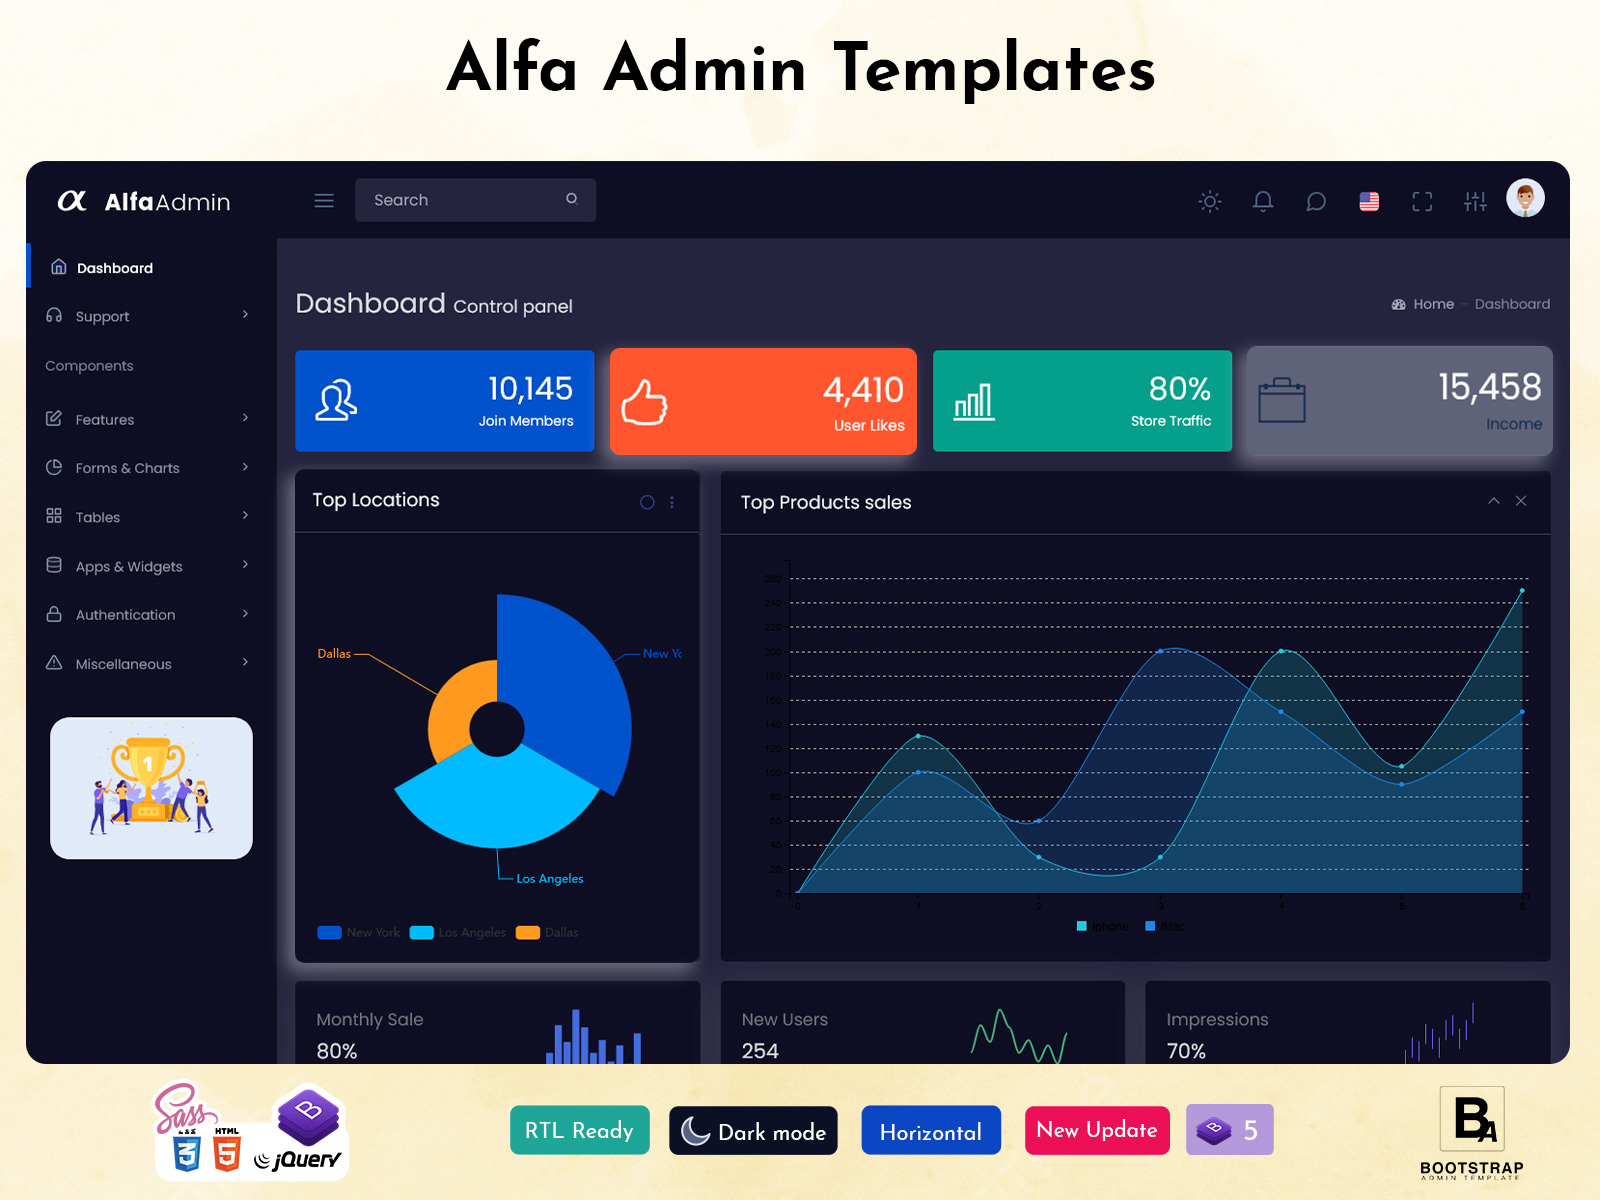
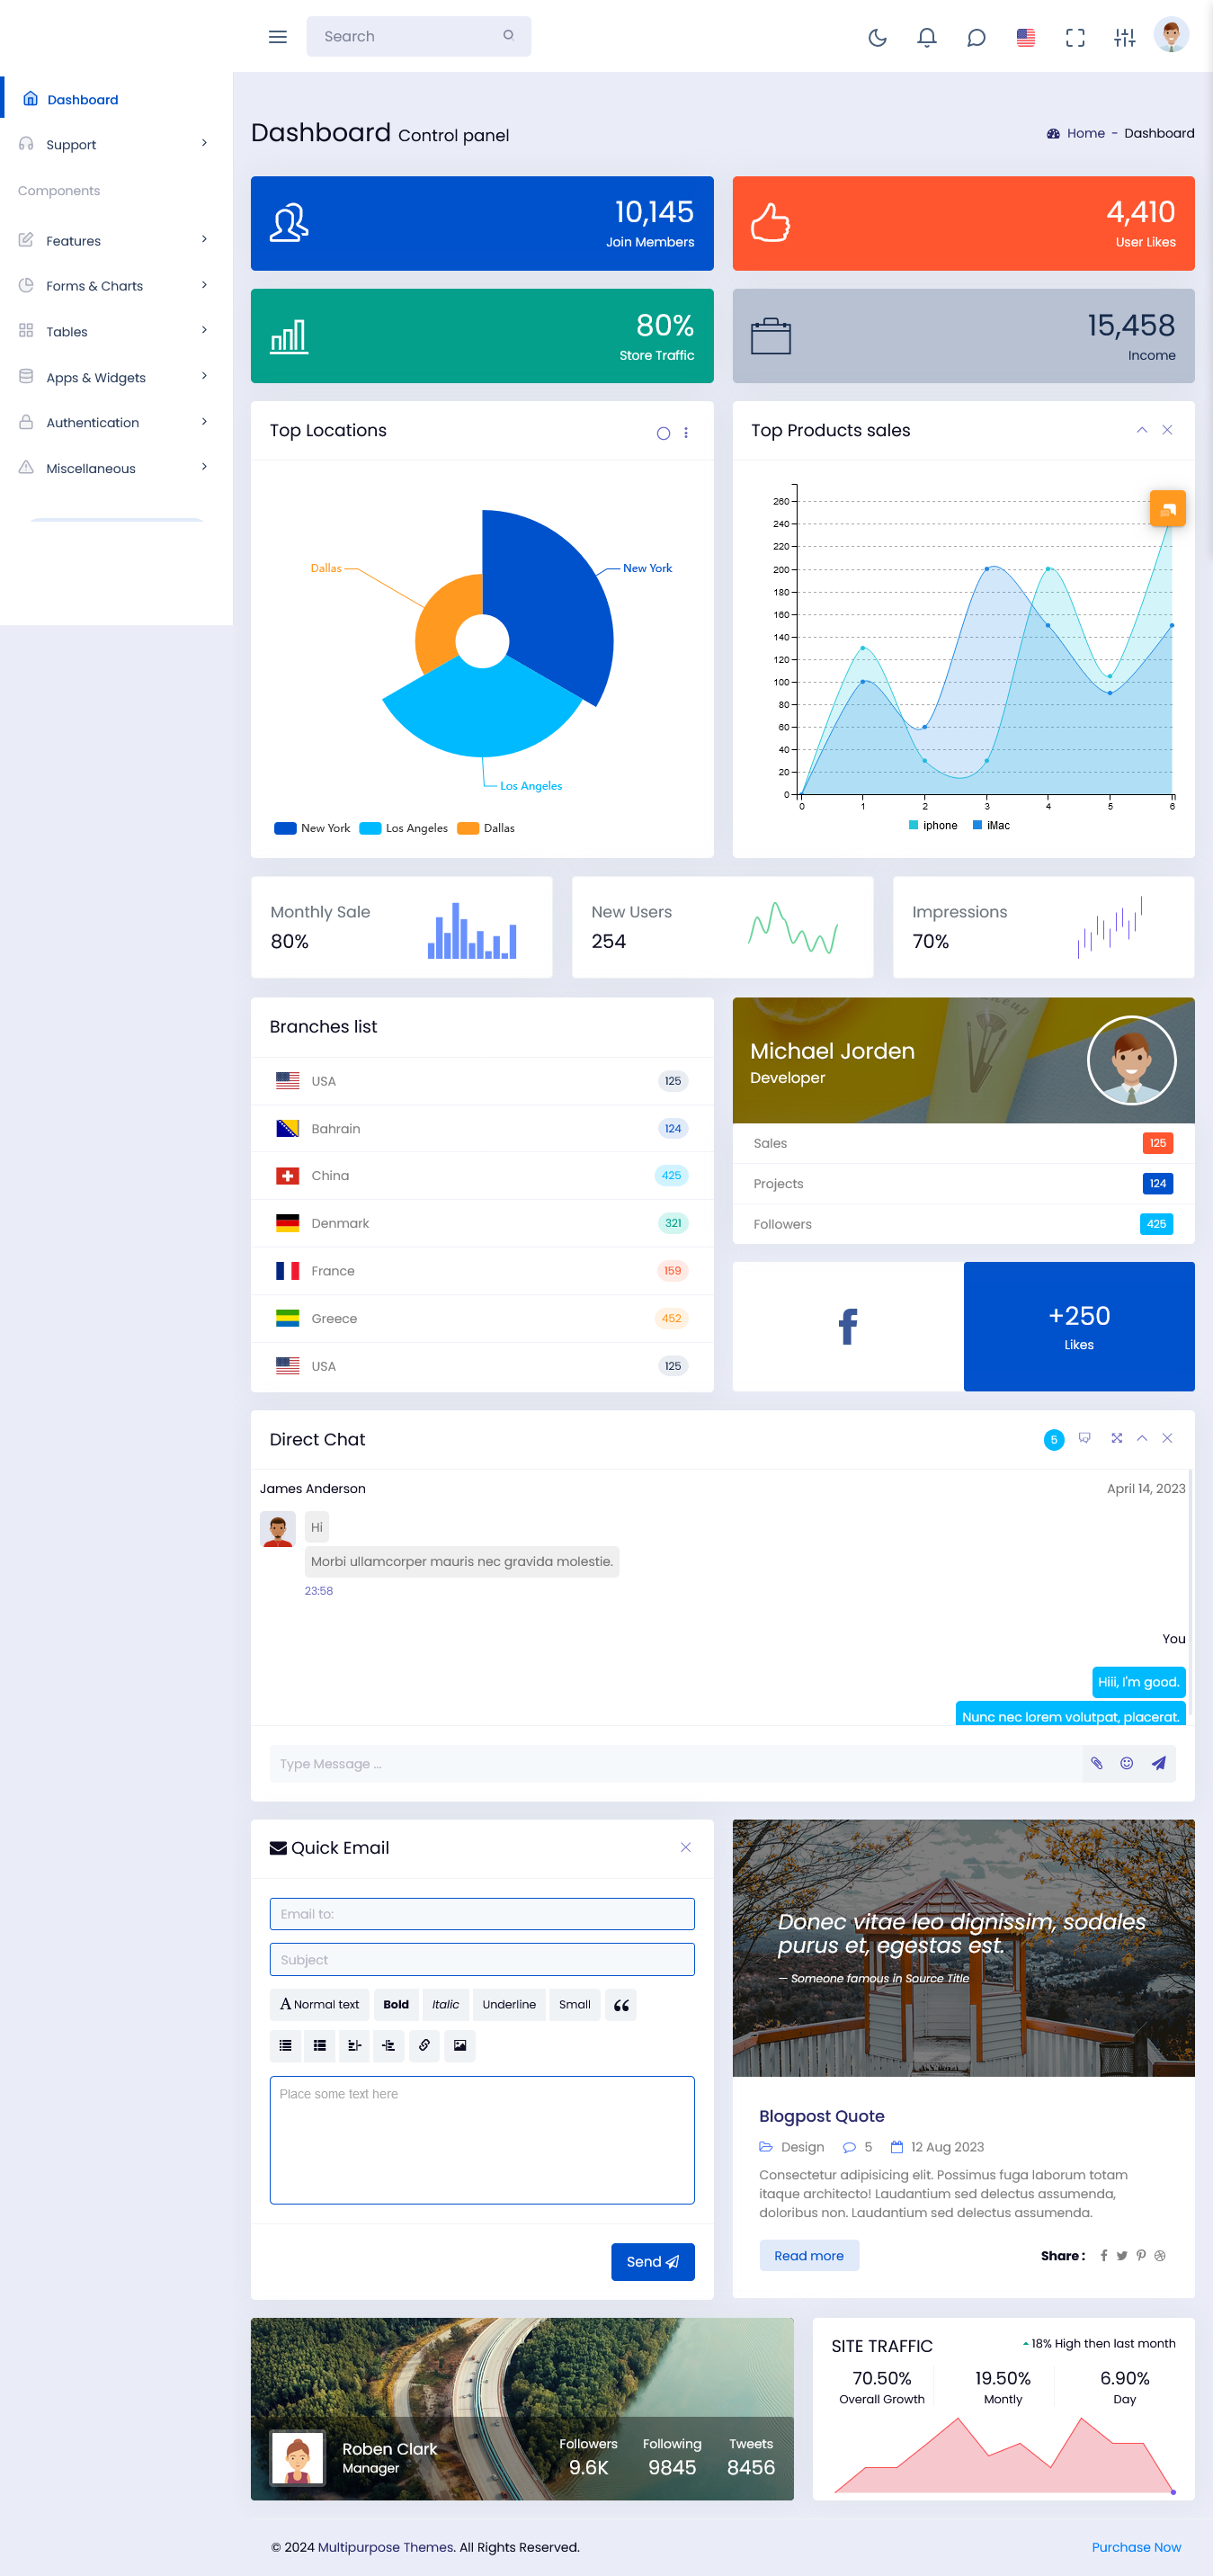
One of the key features of this dashboard is its centralized control panel, which allows users to manage all aspects of their business data in one place. The dashboard is designed to be simple to navigate, even for those who may not be familiar with complex data management systems. It’s built with user-friendly features that allow you to view and track metrics quickly, making it much easier to understand how your business is performing.
With this dashboard, you don’t have to spend time jumping between different tools and platforms to find the data you need. Everything you need to track and analyze is available in one place.
Track New User Growth
As a business grows, it’s crucial to monitor the number of new users or customers that are signing up or making purchases. User growth is a key metric that reflects the success of your marketing and customer acquisition efforts.
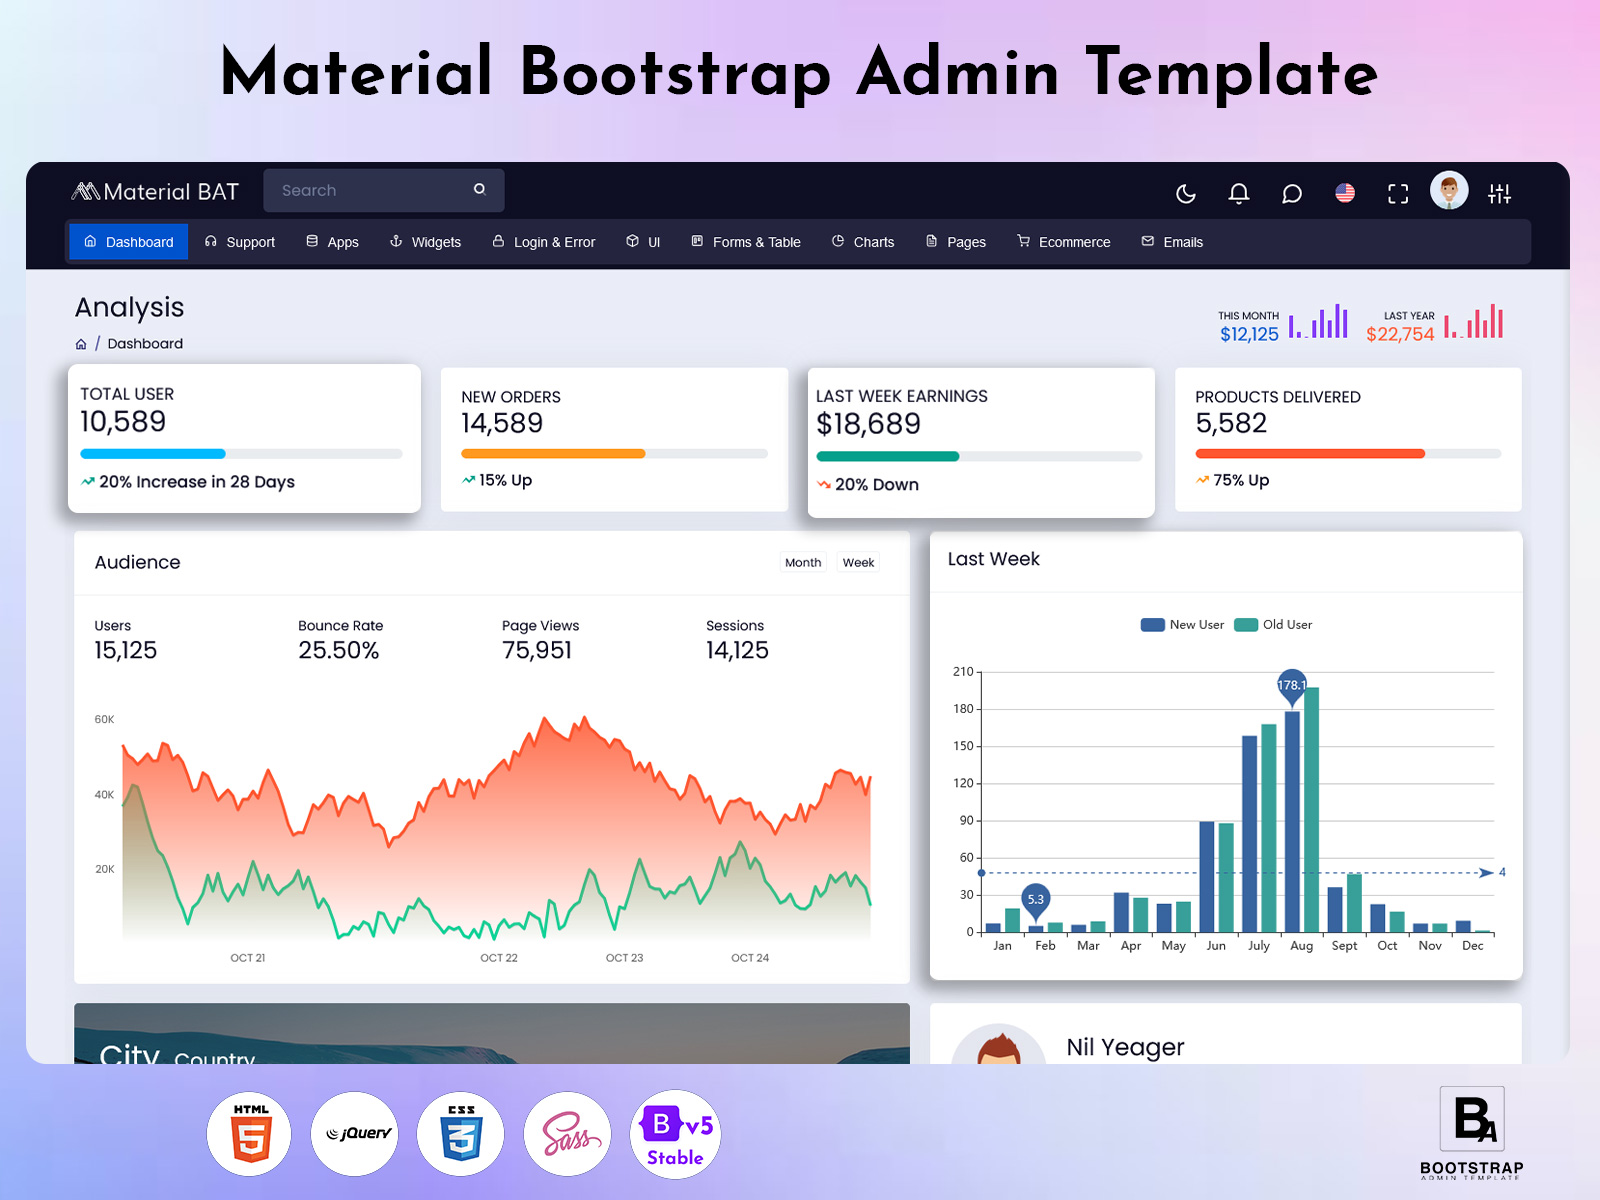
With the Bootstrap Admin Template, you can track this growth using intuitive graphs and numerical summaries. These visual tools give you a clear view of how many new users or customers are joining each day, week, or month. You can also compare new user growth over time to see if your efforts are paying off.
For example, you might notice a spike in new user sign-ups after a marketing campaign or special promotion. By using the dashboard to track this, you can identify trends and adjust your strategies to improve results.
Visualizing Monthly Sales Data
Another essential feature of the Admin Template is its ability to visualize monthly sales data. Understanding your sales performance is crucial for making informed decisions and adjusting your business strategies.
This tool allows you to track monthly sales figures, and you can easily compare this data with the revenue from the previous month. This gives you insight into how your business is performing and whether it is trending up or down. You can spot patterns and make adjustments accordingly.
For instance, if sales drop one month, you can look at factors like promotions, market conditions, or customer feedback to see what might have caused the decline. On the other hand, if you experience a strong sales month, you can see what worked well and try to replicate that success in the future.
Tracking Total Orders and Yearly Sales Trends
The dashboard doesn’t just focus on day-to-day or monthly data; it also provides a long-term view of your business’s performance.
One of the features of the Bootstrap Admin Template is the ability to graphically depict total orders over time. This gives you a quick and easy way to analyze how many orders your business has processed and how this changes over time. You can use this data to identify any seasonal trends or fluctuations in order volume.
In addition to tracking total orders, the dashboard also offers a yearly sales trend feature. This provides a long-term perspective on how your sales are doing year-over-year. By looking at this data, you can identify patterns or trends that might not be obvious when looking at just monthly figures. For example, you might notice that sales tend to increase in certain months, which could help you prepare for seasonal spikes or plan future campaigns.
Visualizing Website Metrics: Page Views and Country-wise Analysis
In today’s digital age, a business’s website is often a key part of its sales and marketing strategy. To ensure that your website is performing well, the dashboard provides website metrics like page views and other traffic-related data.
The increase in page views feature helps you monitor how many people are visiting your site, and whether there are spikes or drops in traffic. This can be especially useful for businesses that rely on online sales or have marketing campaigns designed to drive website traffic.
In addition, the dashboard allows for country-wise analysis of your website traffic. This is particularly useful for businesses that operate in multiple regions or countries. By looking at country-specific data, you can understand where your biggest customer bases are located and adjust your marketing strategies to target those regions more effectively.
Area Charts and Location Summaries
The Dashboard Template also includes area charts, which are another way to visualize business data. These charts are helpful for tracking data over a specific period, such as daily, weekly, or monthly performance. They give a clear visual representation of trends, helping you understand how your business is evolving.
Additionally, the top location summaries feature lets you see where your customers are coming from geographically. Whether you’re selling physical products, digital services, or something in between, understanding your top locations can help you target new markets or optimize your sales strategies for specific regions.
Optimizing Business Strategies
All of these features come together to create a robust solution for monitoring and optimizing business strategies. By providing you with easy access to critical data, the Bootstrap Admin Template helps you make more informed decisions. Whether you’re tracking user growth, monitoring sales trends, or analyzing website traffic, this dashboard template gives you the tools you need to manage and grow your business effectively.
By continuously analyzing these key metrics, businesses can identify areas for improvement and take action. For example, if monthly sales are lower than expected, you can adjust marketing efforts, look for ways to boost product offerings, or improve customer service. Similarly, if user growth is slower than anticipated, you can refine your customer acquisition strategy or enhance your website’s user experience.
Conclusion
In conclusion, the Bootstrap Admin Template offers businesses a powerful and comprehensive suite of tools to manage and track important metrics. From user growth and sales data to website traffic and geographic insights, this Dashboard Template makes it easier for businesses to stay on top of key performance indicators and make data-driven decisions.
Whether you’re a small business or a large enterprise, having access to these insights in a single, easy-to-use platform can greatly improve how you manage and optimize your business. By regularly monitoring and analyzing your data, you can ensure your business stays on track for growth and success in the long term.


