Analytical Dashboard: Benefits, Challenges, and Applications
In the digital age, data is one of the most valuable assets a business can have. But raw data alone means nothing without the tools to interpret, analyze, and act on it. That’s where an Analytical Dashboard comes in. Whether you’re managing a Smart Sales Admin Panel, a CRM, or a complex enterprise platform, an Analytical Dashboard is your window into actionable insights and smarter decisions.
Let’s explore what an Analytical Dashboard is, why it’s so important, its benefits, uses, where you can apply it, and answer some frequently asked questions.
What is an Analytical Dashboard?
An Analytical Dashboard is an interactive visual interface that displays data using Analytical Charts, graphs, and tables. It’s designed to help decision-makers track key metrics, monitor performance, and uncover trends or anomalies in real time.
Unlike simple operational dashboards that only show what’s happening now, an Analytical Dashboard dives deeper — letting users slice and dice data, compare time periods, and find the “why” behind the numbers.
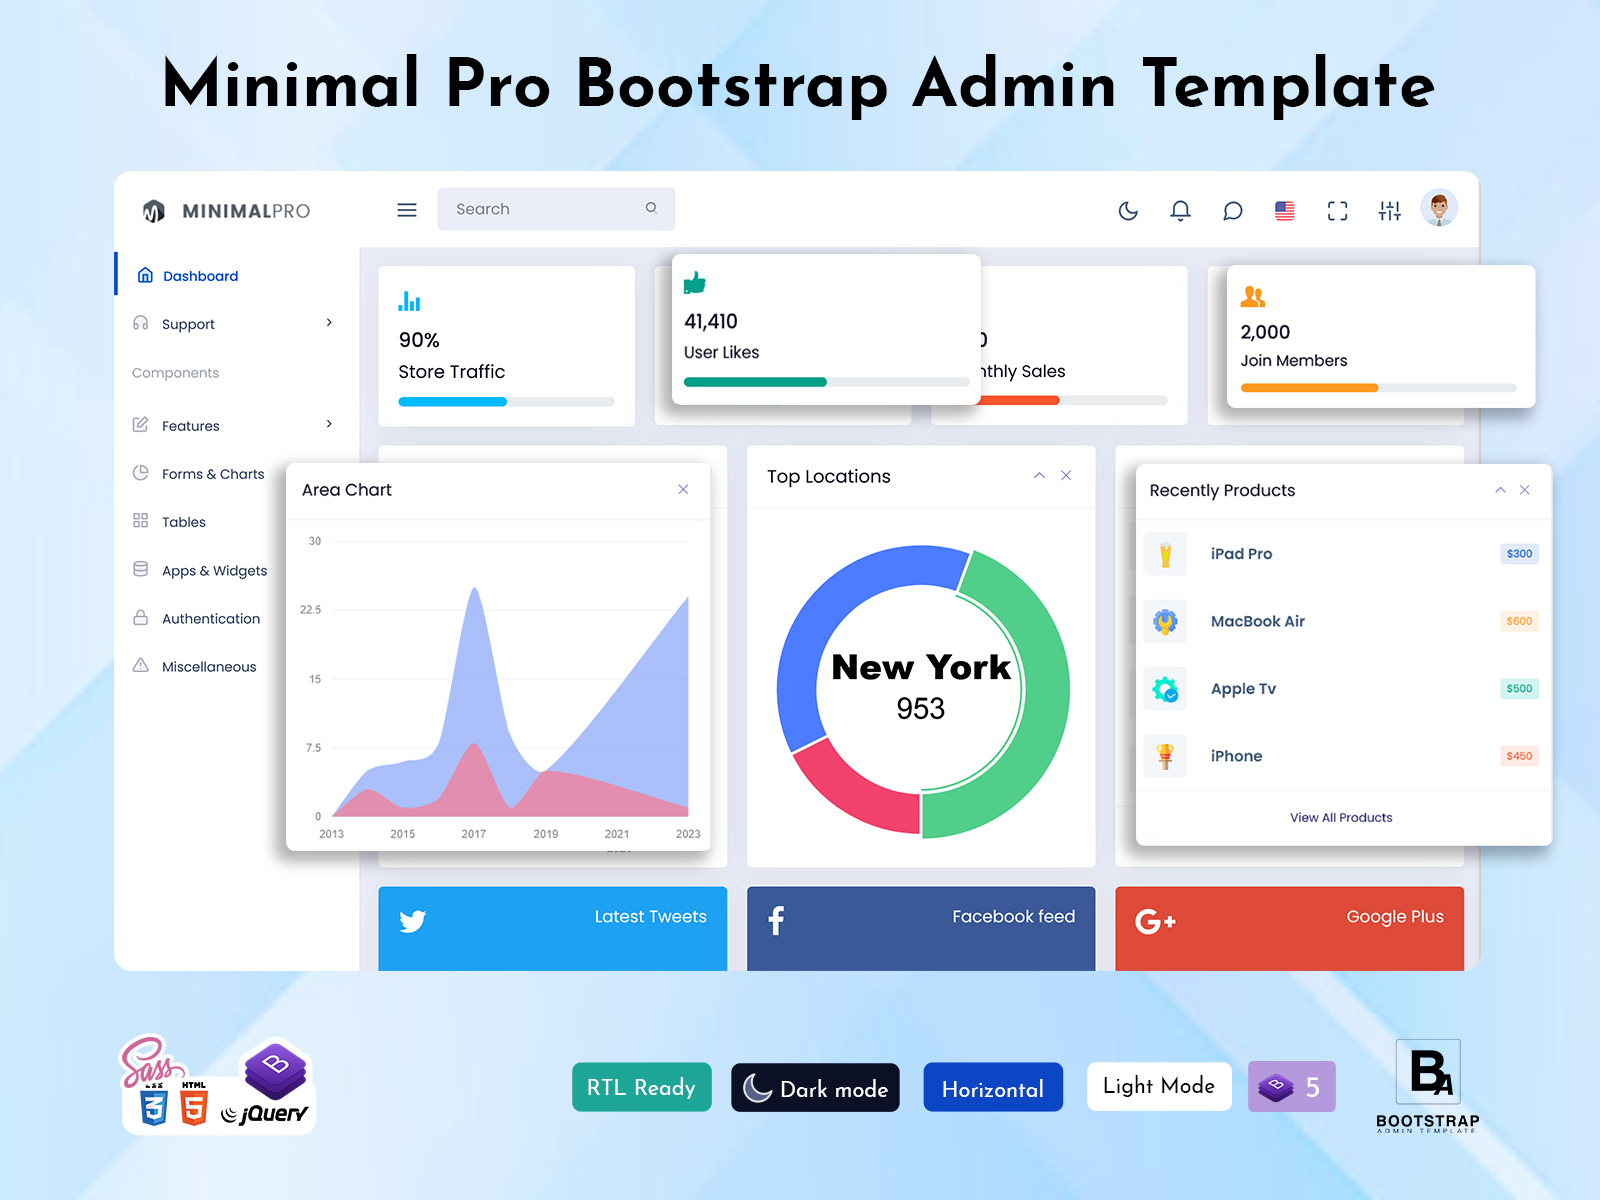
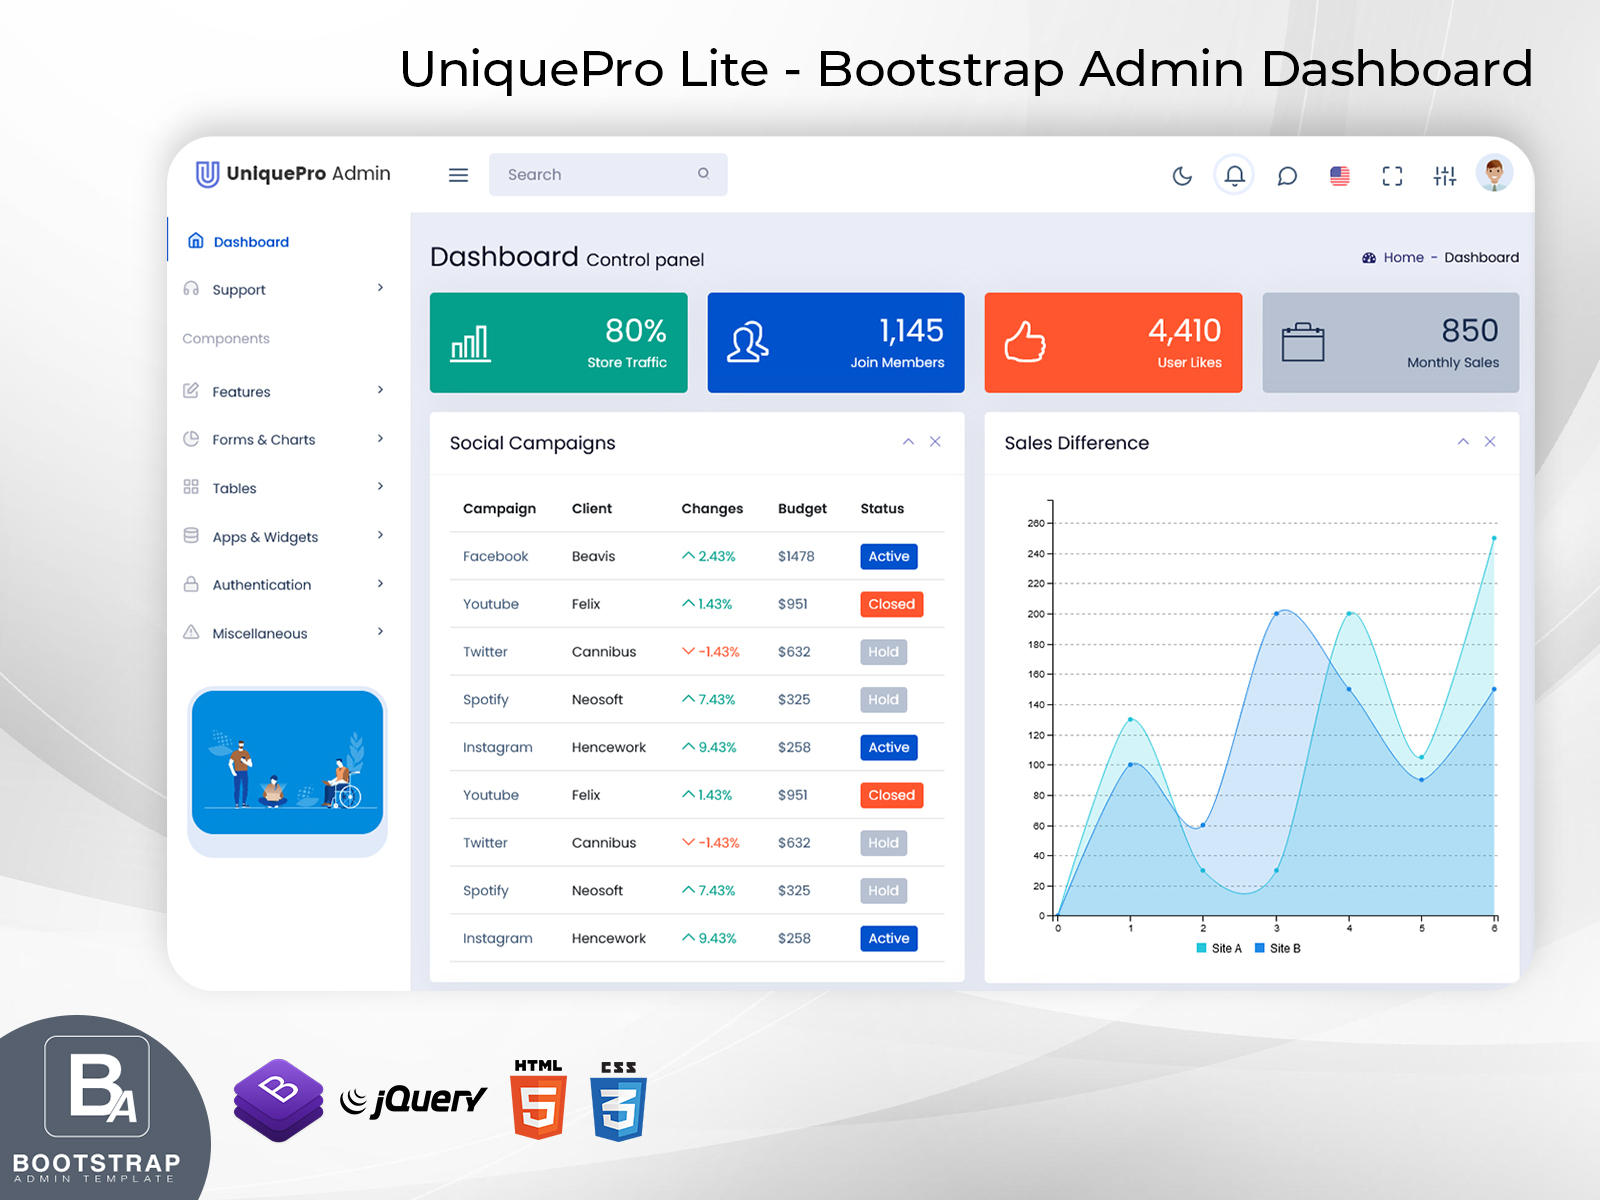
Modern dashboards are often built using flexible Admin Templates, like a Bootstrap Admin Template, to ensure they’re responsive, user-friendly, and easy to customize. For example, a well-designed Bootstrap Admin Dashboard gives teams a clean structure for visualizing data with a consistent look across devices.
Explore Dashboard Layouts
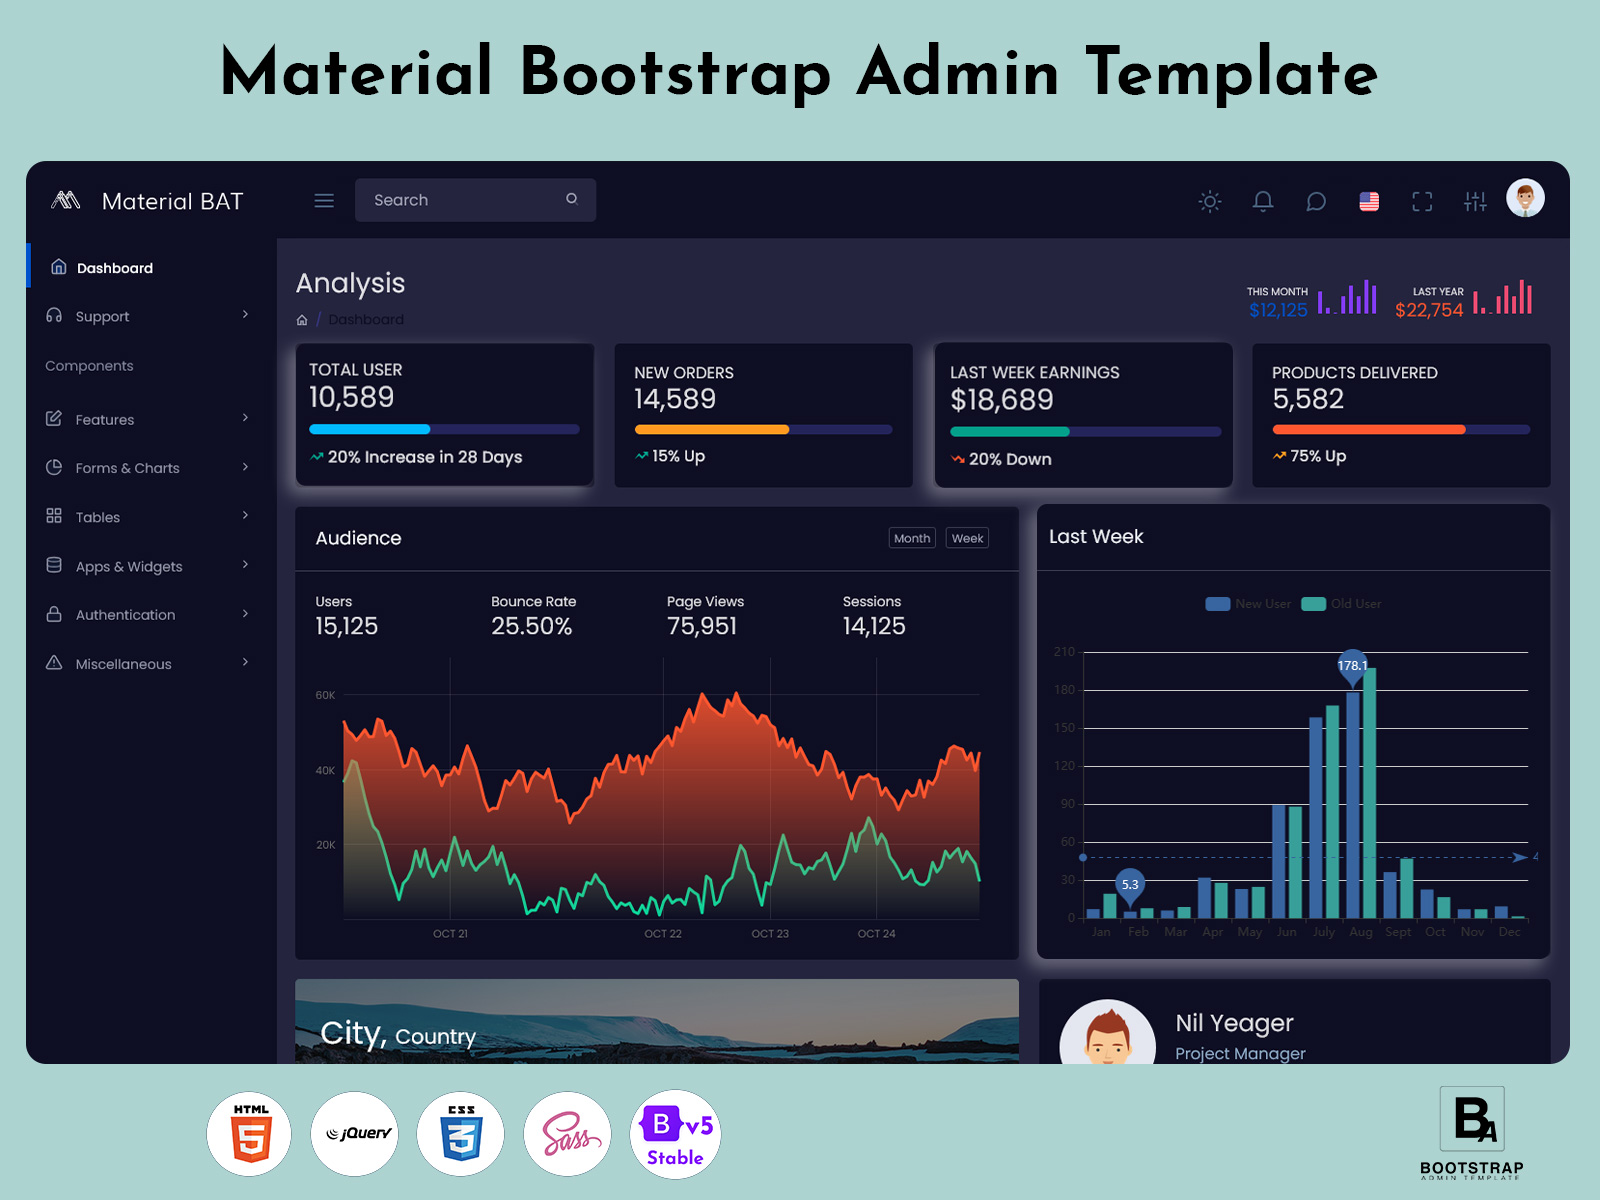
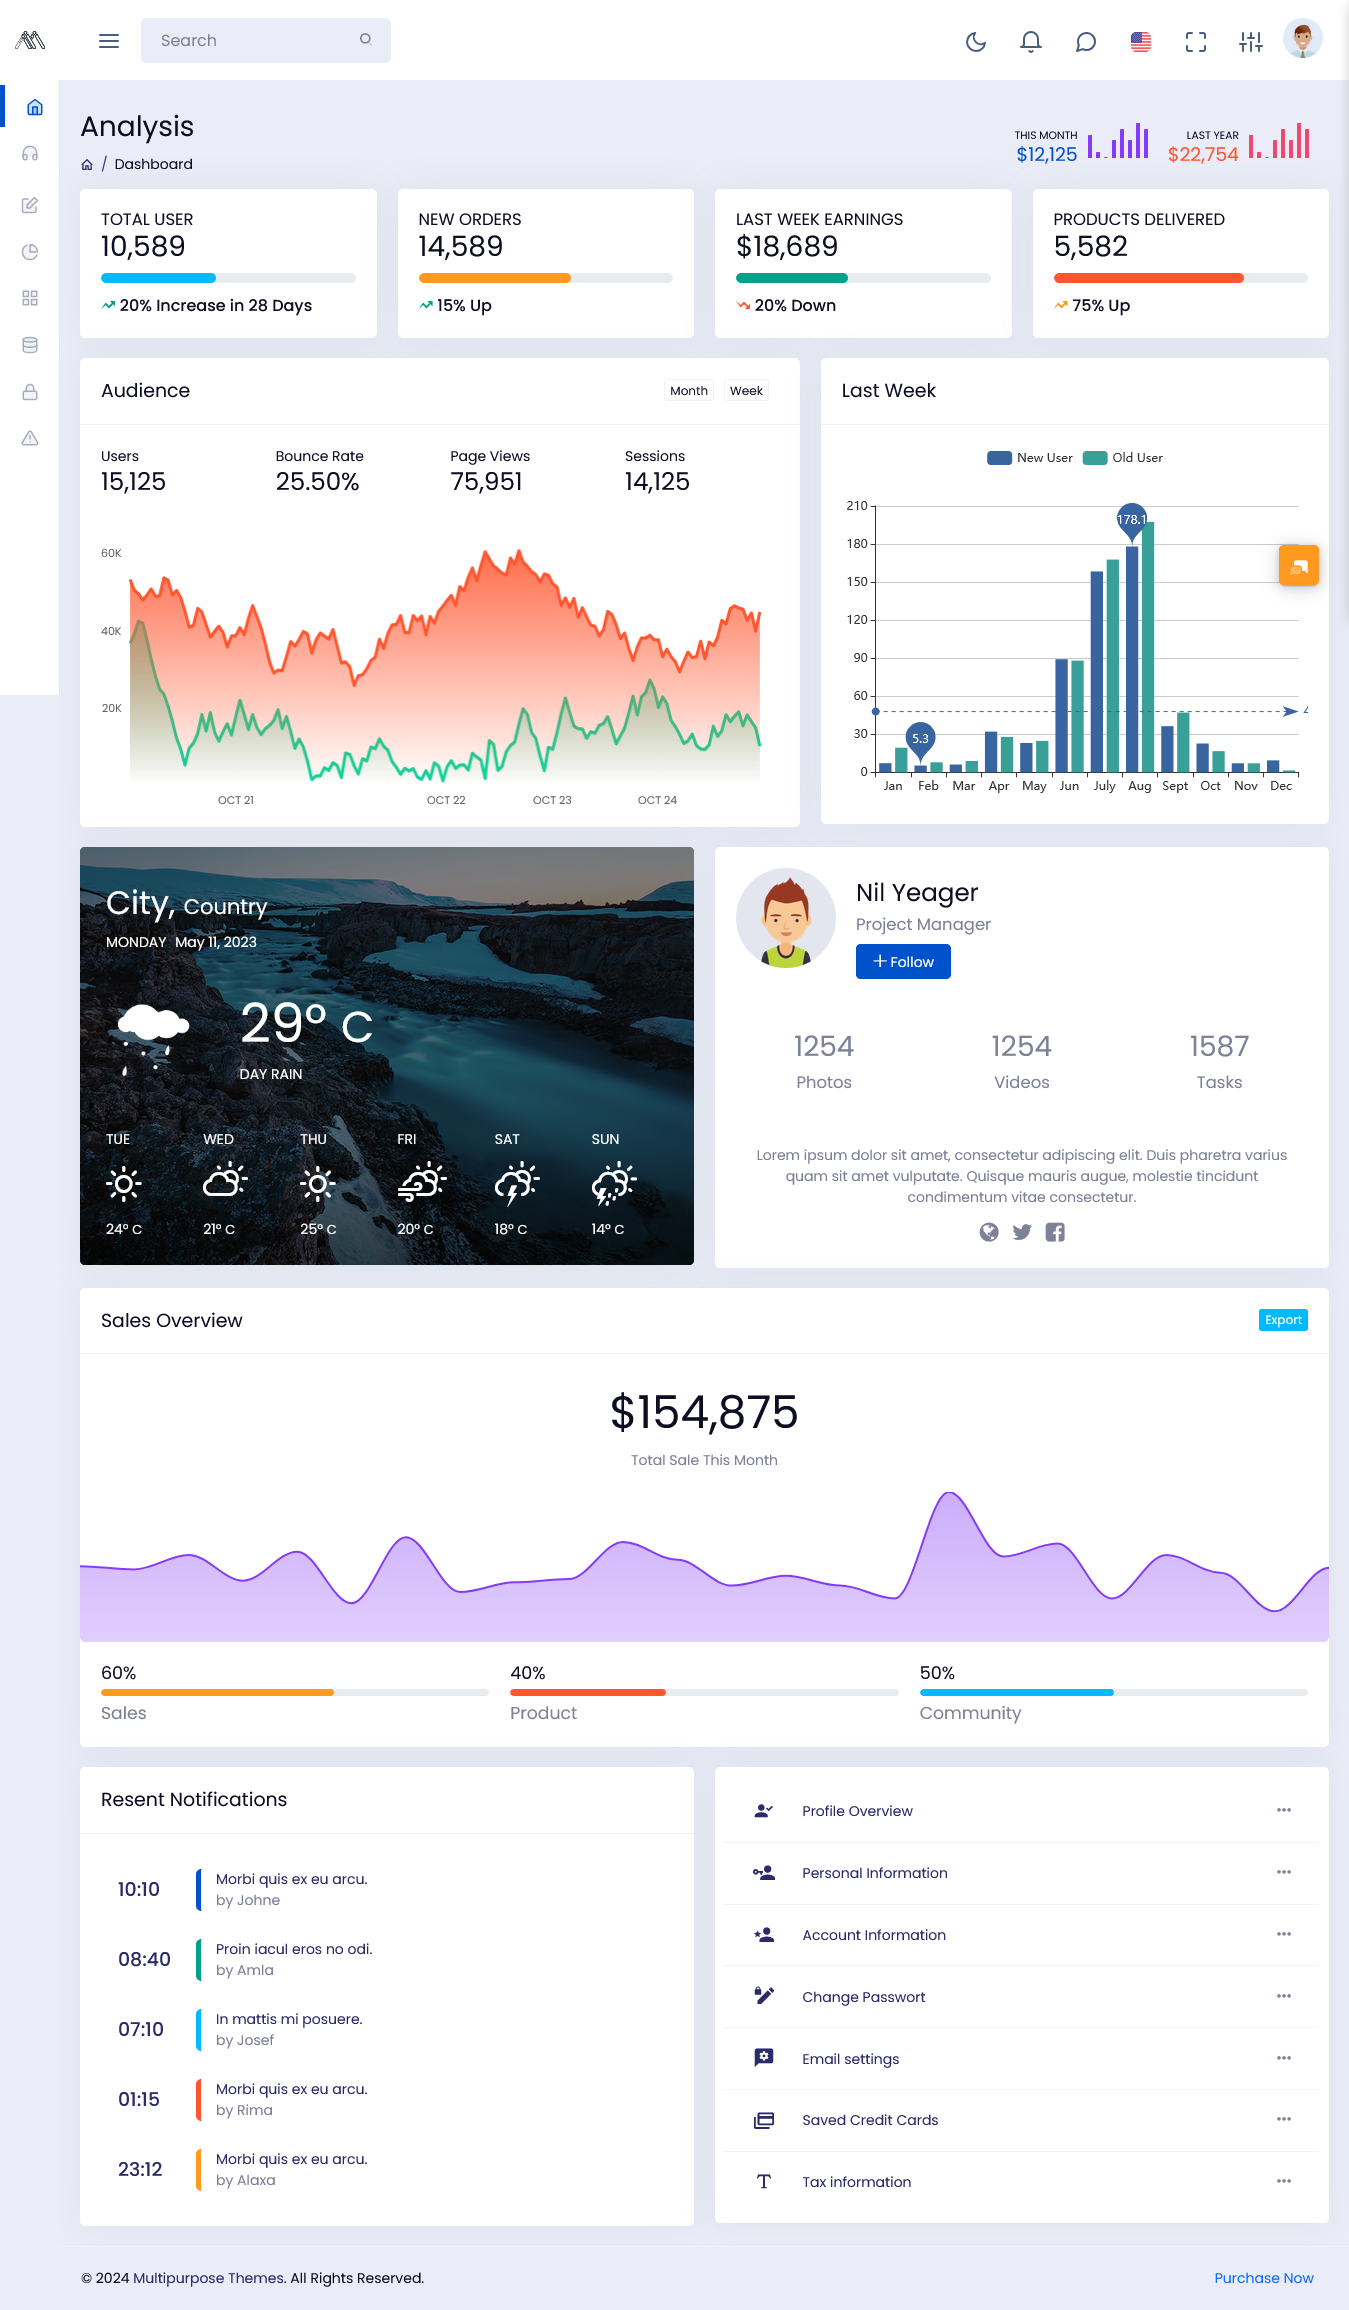
Light Dashboard
BUY NOW DEMO
Dark Dashboard
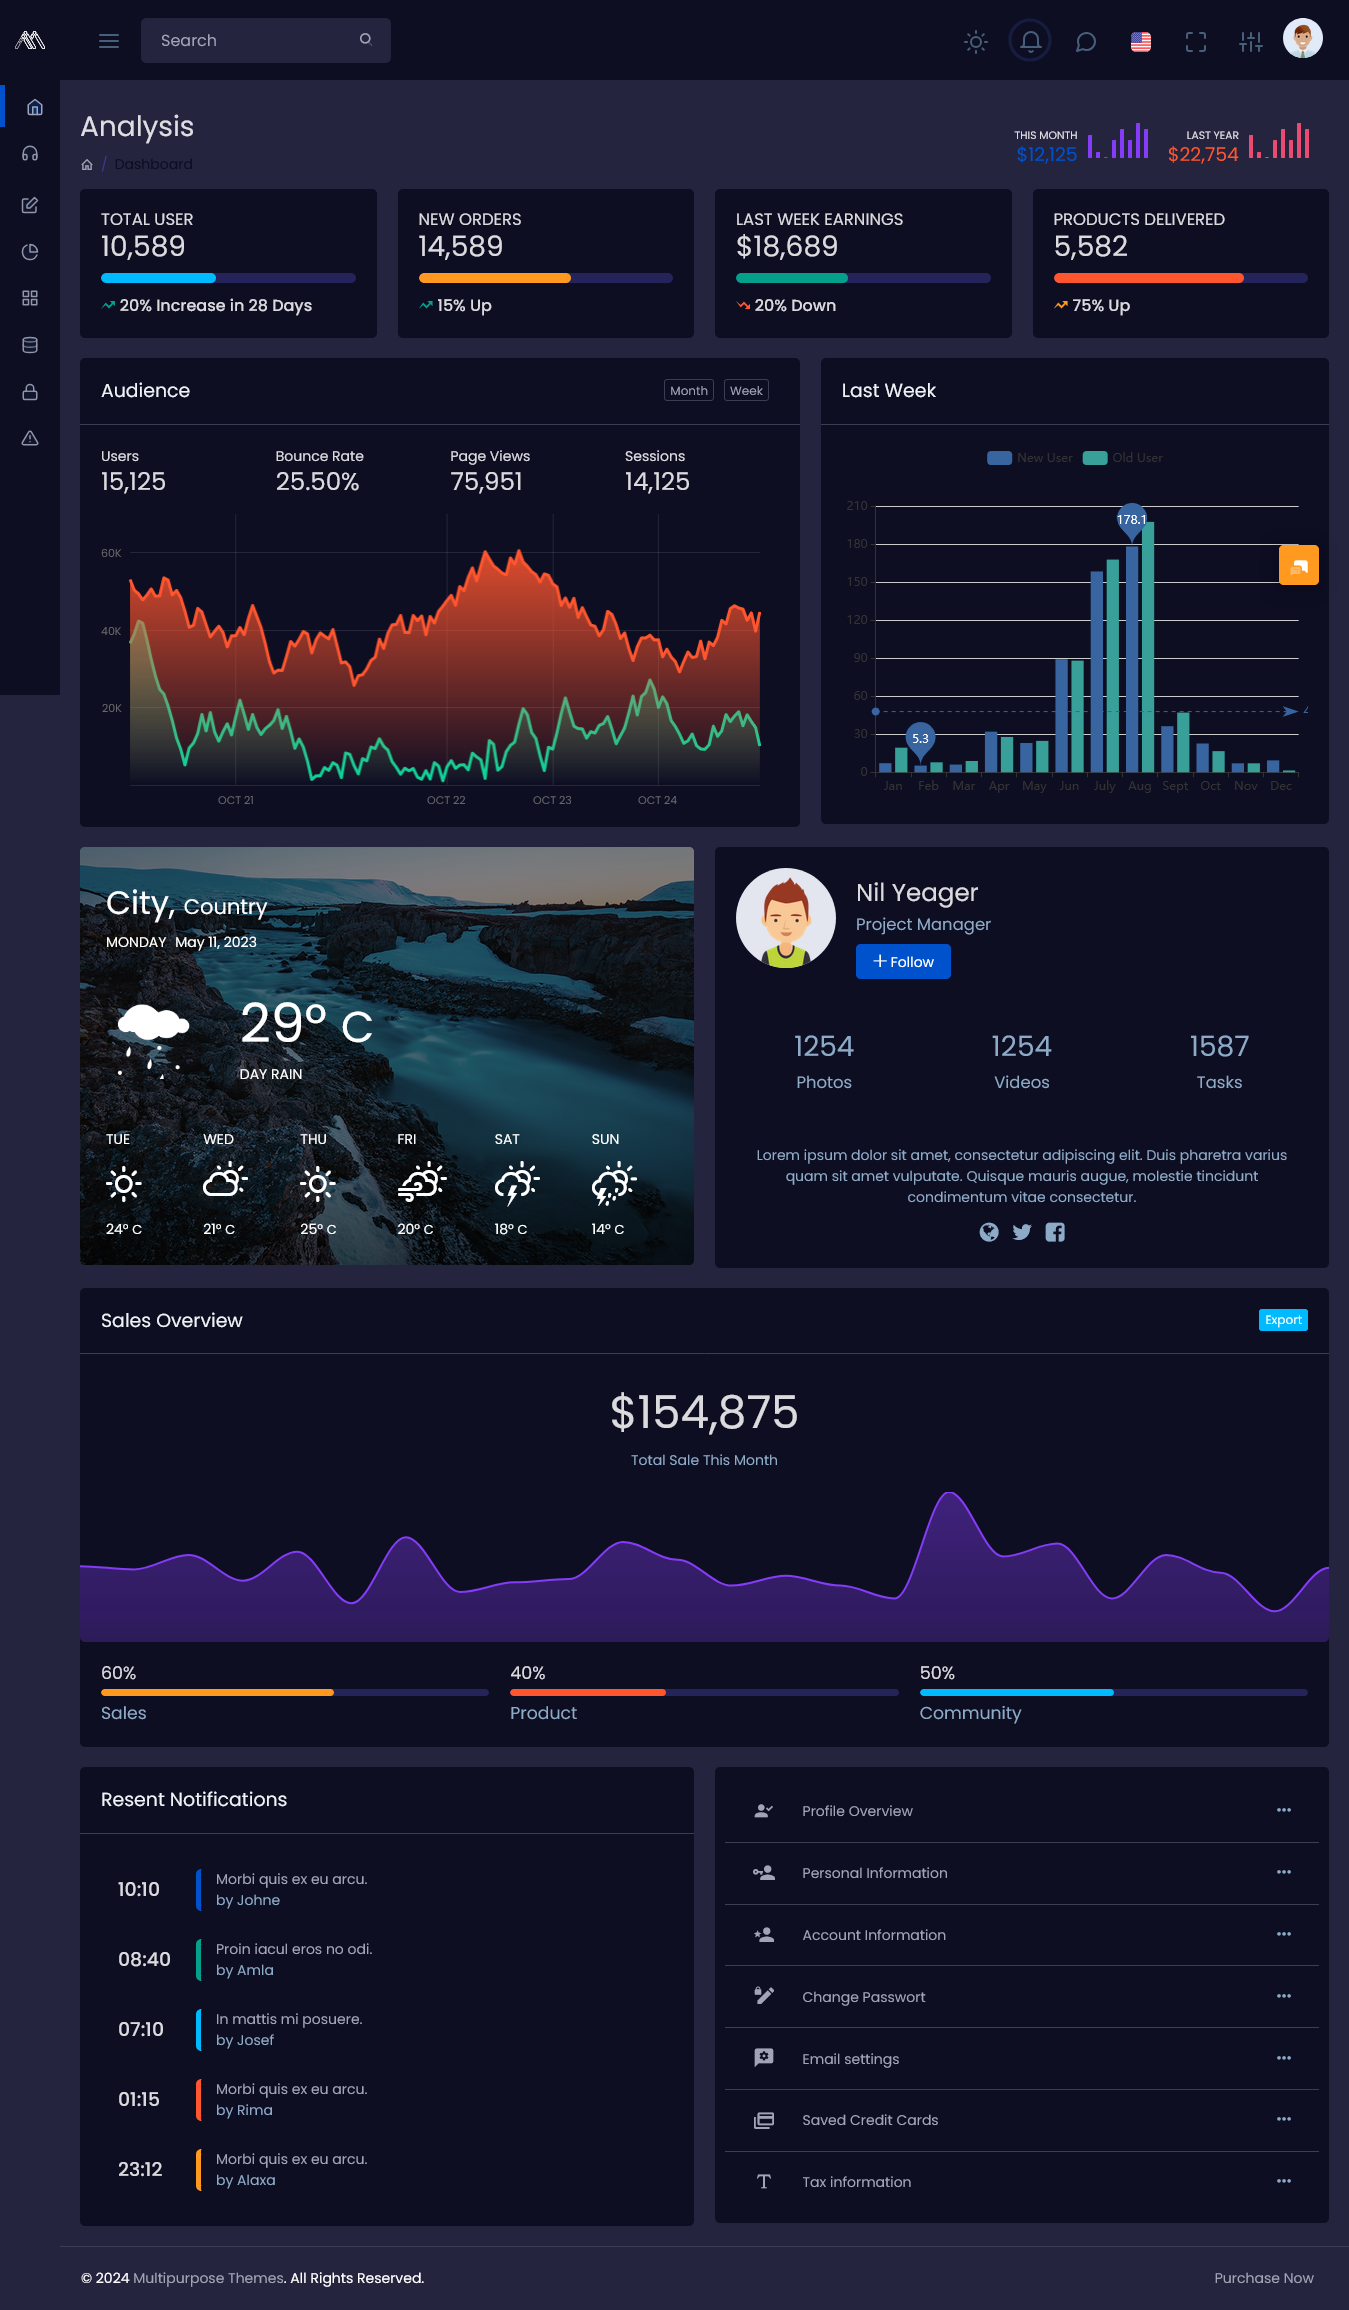
BUY NOW DEMO
Why is an Analytical Dashboard Important?
The main reason companies invest in Analytical Dashboards is that they turn overwhelming data into clear, digestible information. Without it, organizations risk making decisions based on gut feeling rather than evidence.
A robust Analytical Dashboard built with a good Bootstrap Admin HTML framework allows executives, sales managers, and analysts to see patterns they might otherwise miss. Whether you’re using CRM Dashboard Templates to track customer behavior or a Smart Sales Admin Panel to monitor sales targets, an Analytical Dashboard acts as your real-time command center.
Businesses that adopt an Analytical Dashboard culture are more agile, data-driven, and better equipped to respond to market changes — a competitive advantage that shouldn’t be underestimated.
Benefits of an Analytical Dashboard
– Real-Time Insights
An Analytical Dashboard provides live data feeds, so you always know what’s happening right now. This is invaluable for sales teams using a Smart Sales Admin Panel or CRM.
– Informed Decision-Making
Data-driven decisions are more reliable. By visualizing performance with clear Analytical Charts, leaders can identify what’s working, spot risks early, and allocate resources wisely.
– Time Savings
No more endless spreadsheets. A good Bootstrap Admin Dashboard automatically pulls in data from multiple sources, saving teams hours of manual reporting.
– Improved Collaboration
Analytical Dashboards centralize information, creating a single source of truth. Teams across departments — sales, marketing, operations — can work from the same numbers.
– Customizable & Scalable
Modern Admin Templates and CRM Dashboard Templates are built on flexible frameworks like Bootstrap Admin HTML. This means your dashboard can grow and adapt as your business does.
– Better Customer Understanding
For CRM-focused teams, an Analytical Dashboard highlights customer trends and preferences, helping you tailor campaigns, boost loyalty, and drive growth.
Uses of Analytical Dashboard
An Analytical Dashboard can be applied in virtually any industry or department. Here are some common examples:
- Sales & Revenue Monitoring
A Smart Sales Admin Panel combines sales targets, revenue growth, and lead performance in one place. Sales managers can forecast results and adjust strategies instantly.
- CRM Performance Tracking
Using CRM Dashboard Templates, businesses track customer interactions, conversion rates, and retention metrics — all visualized through meaningful Analytical Charts.
- Financial Analysis
Finance teams use Analytical Dashboards to monitor expenses, profit margins, and budget variances. Clear data helps them spot cost-saving opportunities quickly.
- Marketing Campaigns
Marketers rely on Analytical Dashboards to measure ROI, website traffic, and ad performance. This data-driven approach ensures marketing spend is effective.
- Operations & Logistics
In supply chain management, an Analytical Dashboard can track inventory levels, order fulfillment, and delivery performance to improve efficiency.
- HR & Workforce Management
HR departments use dashboards to analyze hiring trends, employee turnover, and training effectiveness, ensuring they attract and retain top talent.
Where Analytical Dashboards Can Apply
The possibilities for Analytical Dashboards are endless. Any organization that collects data can benefit. For example:
– Retail — To track sales trends, stock levels, and customer preferences.
– Healthcare — To monitor patient outcomes, staff performance, and resource utilization.
– Manufacturing — To oversee production lines, quality control, and supply chain efficiency.
– Education — To analyze student performance, enrollment rates, and faculty productivity.
– Financial Services — To manage risk, forecast profits, and maintain compliance.
The key is choosing the right Admin Template and tech stack, like a Bootstrap Admin Template, to ensure your Analytical Dashboard is robust, secure, and easy to use.
Challenges of Analytical Dashboards
While the benefits are clear, it’s important to acknowledge the challenges too:
🔍 Data Quality — Insights are only as good as the data behind them. Poor data quality can lead to misleading conclusions.
⚙️ Integration — Combining data from multiple sources requires reliable integration tools. A well-built Bootstrap Admin Dashboard helps here.
👥 User Adoption — Teams need training to use Analytical Dashboards effectively. If people don’t trust or understand the data, they won’t use it.
🔐 Data Security — Sensitive data must be protected. Strong security within your Bootstrap Admin HTML framework is a must.
FAQs
Q1: Is an Analytical Dashboard suitable for small businesses?
Absolutely! Even small businesses benefit from a simple Bootstrap Admin Dashboard to track KPIs, manage sales with a Smart Sales Admin Panel, and make smarter decisions.
Q2: Can I build my own Analytical Dashboard?
Yes, using ready-to-use Admin Templates and CRM Dashboard Templates built with Bootstrap Admin HTML, you can customize dashboards without starting from scratch.
Q3: What are Analytical Charts?
Analytical Charts are visual representations of data — such as line graphs, bar charts, or heatmaps — that help you analyze trends and relationships.
Q4: How often should I update my dashboard?
The best Analytical Dashboards pull data in real-time or update frequently to reflect the most current information.
Q5: What’s the difference between an operational and Analytical Dashboard?
An operational dashboard shows what’s happening now, while an Analytical Dashboard dives deeper to explain why trends occur, using Analytical Charts and visual insights.
Final Thoughts
An Analytical Dashboard is one of the most powerful tools for turning data into strategic advantage. Whether you’re using it with a Smart Sales Admin Panel, CRM system, or operations hub, the right Bootstrap Admin Template can help you visualize your data with clarity and confidence.
Ready to harness your data? Invest in a well-designed Analytical Dashboard — and unlock a smarter, data-driven future for your business.
For more premium Bootstrap Admin Templates, please visit our website. Explore a wide range of powerful and customizable dashboards tailored to your needs!
Bootstrap Admin Template