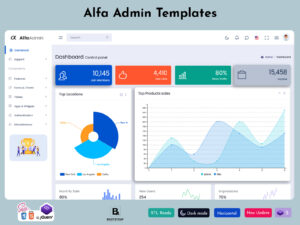
Analytical Dashboard: Industries & Advantages
In a data-driven world, the Analytical Dashboard has become an essential tool for businesses in every industry. From tracking sales performance to understanding customer behavior, a well-designed Analytical Dashboard helps organizations turn raw data into clear, actionable insights. When built with a robust Bootstrap Admin Template or Admin Dashboard UI Kit, these dashboards are responsive, user-friendly, and customizable for any business need.
In this post, you’ll discover how an Analytical Dashboard works, which industries benefit most, key features you should look for, and how it can give your business a competitive edge in 2025.
Explore Dashboard Design
BUY NOW DEMO
What is an Analytical Dashboard?
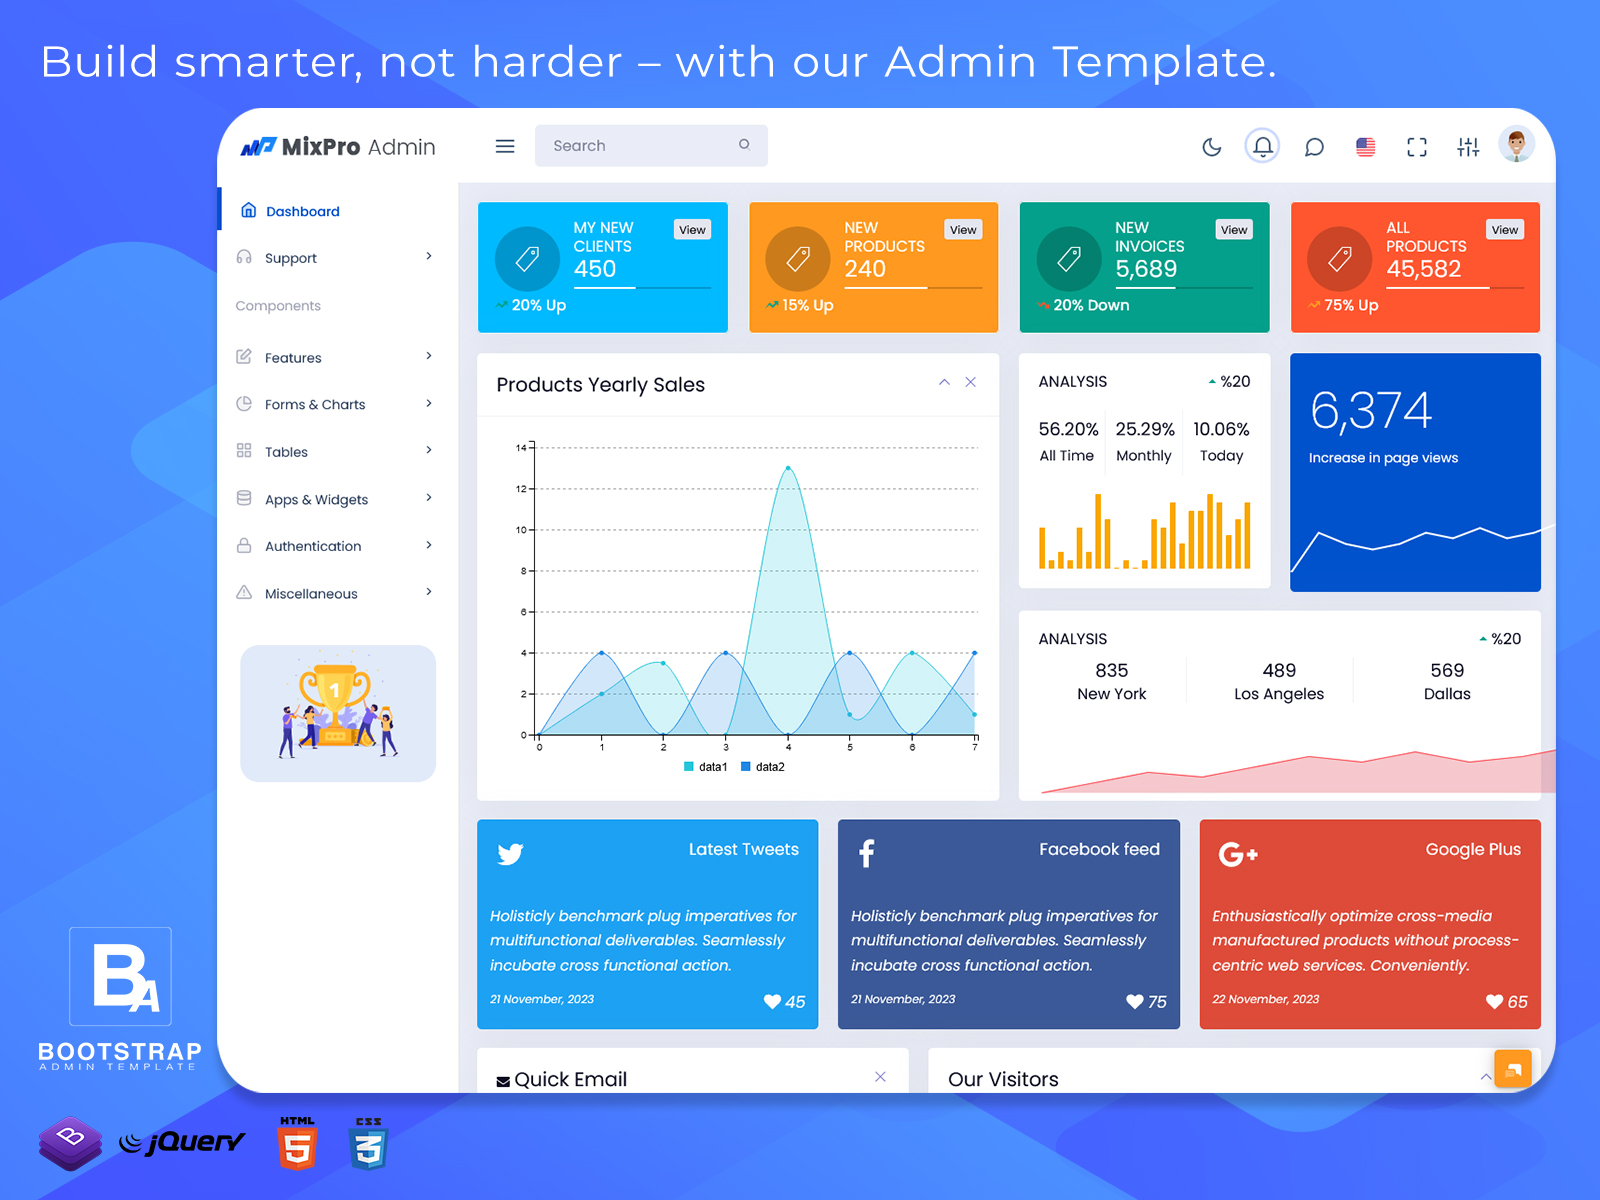
An Analytical Dashboard is a visual reporting tool that displays your key metrics in real time. It combines Analytical Charts, graphs, and data widgets so you can easily monitor KPIs like sales, user engagement, and web traffic.
Unlike basic Sales Dashboards, which often show only top-level figures, an Analytical Dashboard digs deeper — helping managers spot trends, detect problems, and make smart decisions fast. With a flexible Bootstrap Admin Dashboard, you can add or remove widgets as needed, so your dashboard always fits your goals.
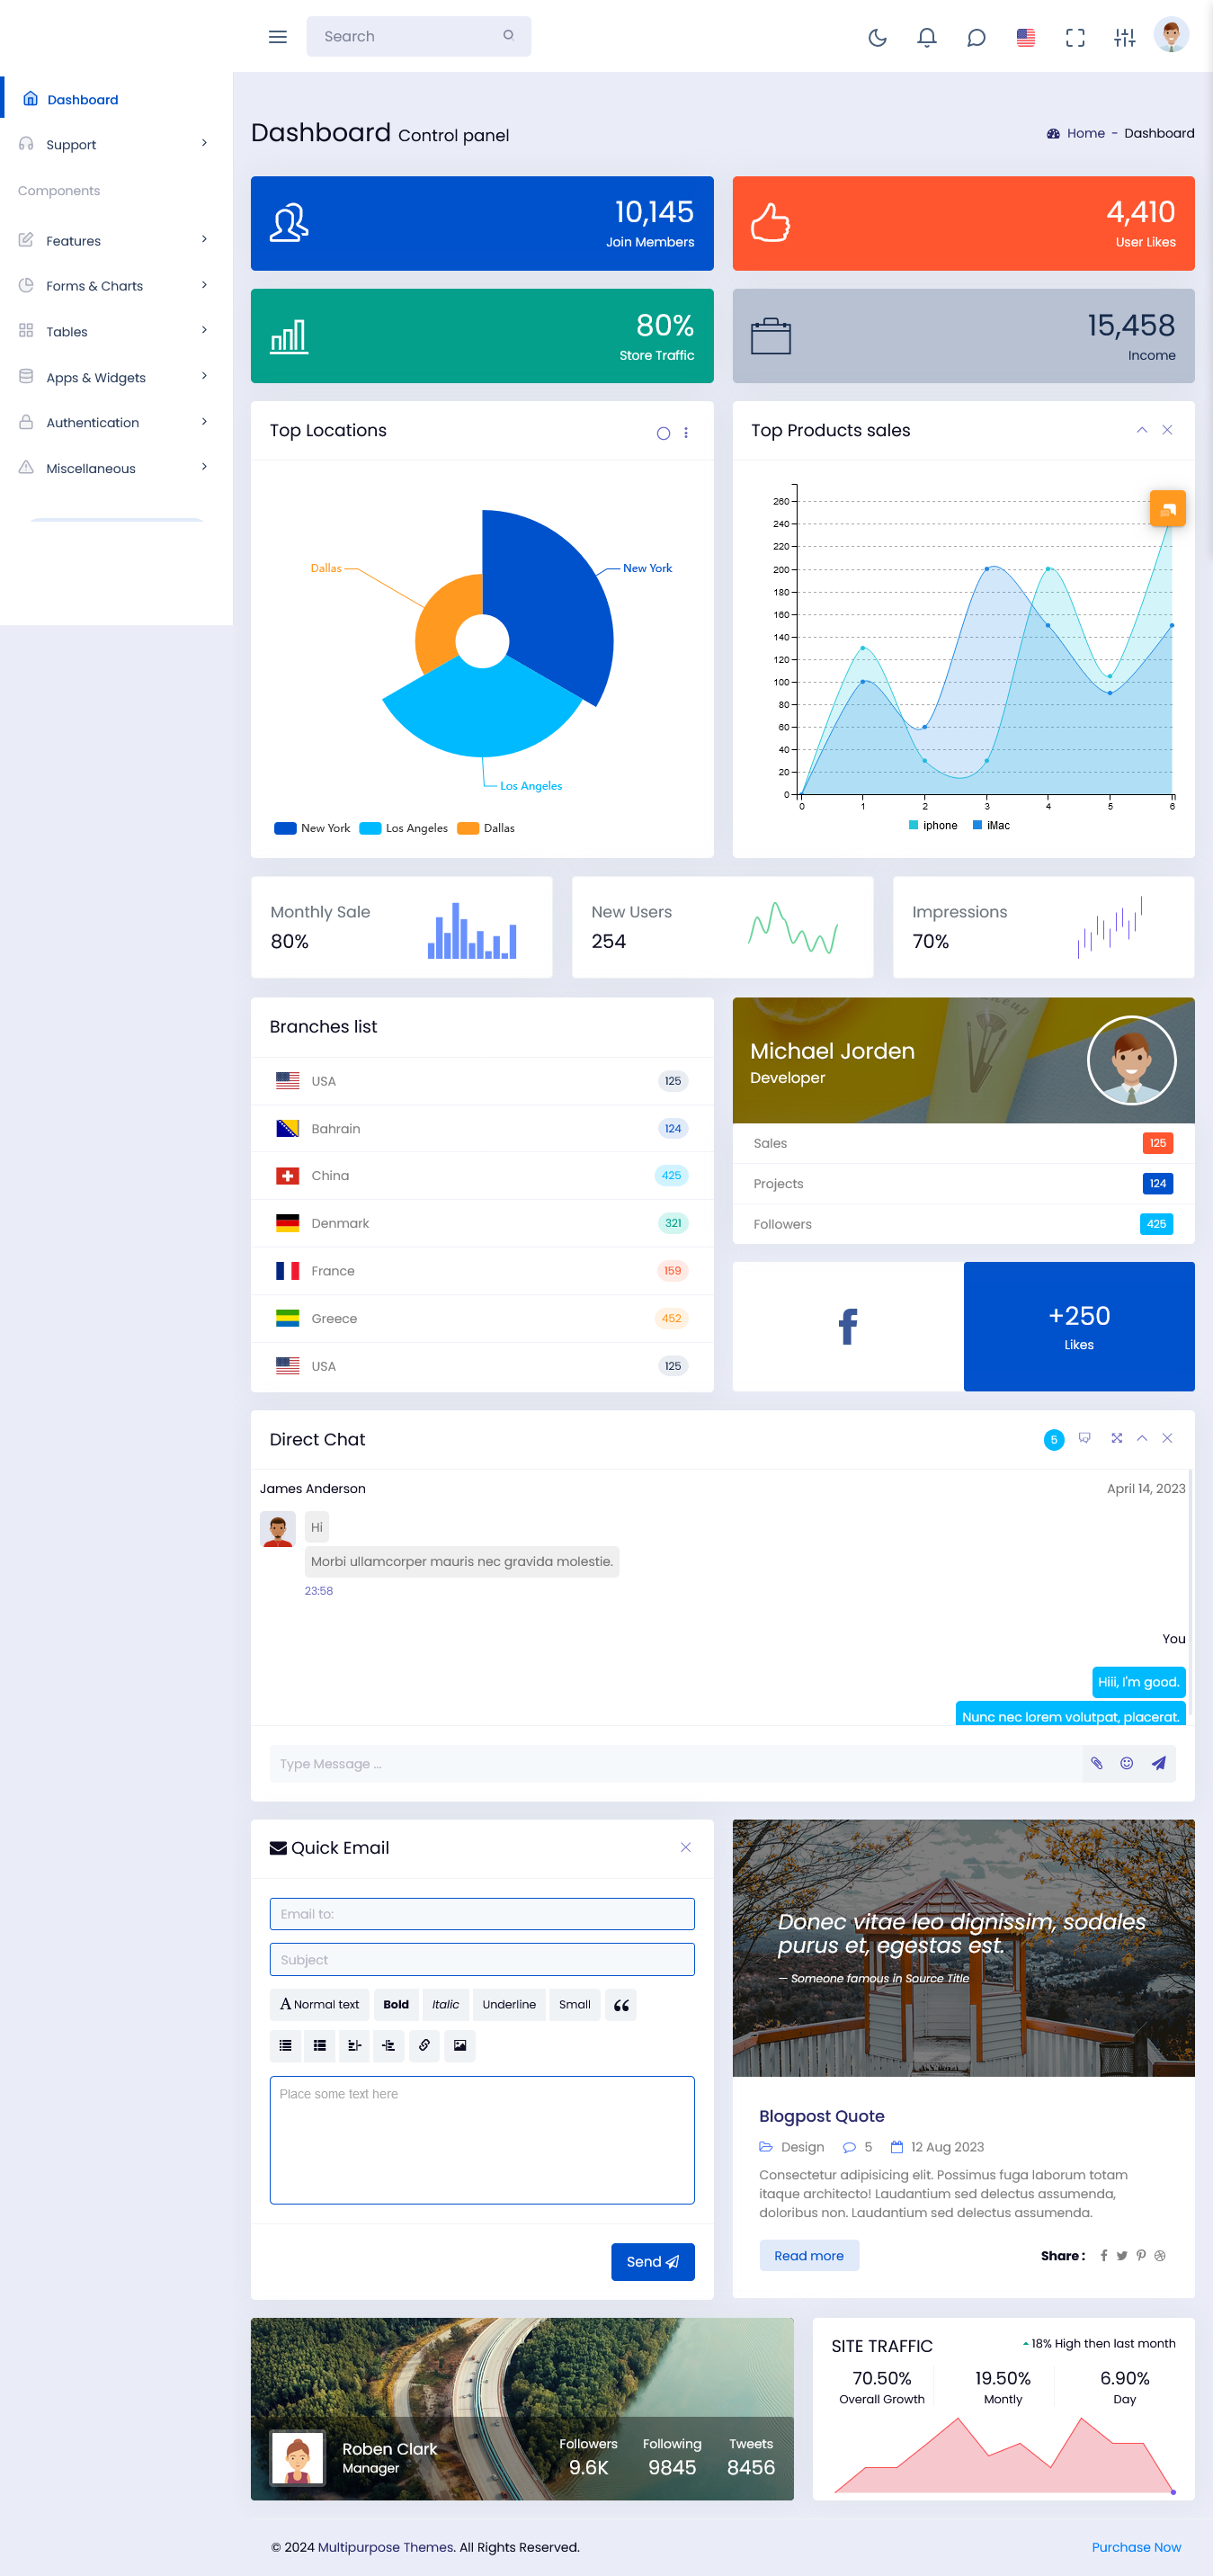
Features of a Great Analytical Dashboard
A powerful Analytical Dashboard should include widgets and modules that help you see the bigger picture. Let’s break down some popular features and why each one matters for growing companies:
– Join Members
This widget shows the number of new members or subscribers joining your platform.
Why it’s important: It helps you track growth, measure the impact of campaigns, and see how your audience is expanding.
– User Likes
The User Likes metric tells you how users interact with your products or content.
Why it’s important: More likes signal higher engagement, so you can focus on what your audience truly loves.
– Store Traffic
This shows the volume of visitors to your store or website.
Why it’s important: With good Analytical Charts, you can see which channels drive the most traffic, so you can invest marketing dollars wisely.
– Income
Every Analytical Dashboard should display revenue figures front and center.
Why it’s important: It helps you monitor daily, weekly, or monthly income and forecast trends — a must for every Smart Sales Admin Panel.
– Top Locations
The Top Locations widget shows where your customers come from.
Why it’s important: It’s vital for regional marketing and helps you target ads and promotions more effectively.
– Top Product Sales
Knowing which products sell best helps you plan inventory and promotions.
Why it’s important: Top sellers often reveal where you should focus your sales efforts and how to cross-sell related items.
– Monthly Sale
This metric visualizes monthly revenue trends.
Why it’s important: Comparing month-over-month sales helps you see seasonal patterns and set realistic goals.
– New Users
Track the number of new sign-ups or customers joining your service.
Why it’s important: It shows whether your growth efforts are paying off — and where you might need to optimize.
– Impressions
Impressions measure how many times your ads, content, or listings have been seen.
Why it’s important: More impressions mean greater reach and awareness, which fuels your entire sales funnel.
– Branches List
For multi-location businesses, a Branches List widget lets you manage performance by location.
Why it’s important: It’s invaluable for franchises or retail chains that want to compare branch-level data.
– Direct Chat
Built-in chat tools make your Analytical Dashboard more interactive.
Why it’s important: They let teams or sales reps connect directly with leads and customers, boosting conversion rates.
– Quick Email
Quick Email tools allow you to send updates, promotions, or reminders from your dashboard.
Why it’s important: It saves time and keeps your outreach organized without needing a separate email tool.
– Site Traffic
Every Admin Template should have clear Analytical Charts for site traffic.
Why it’s important: It shows how well your website attracts and retains visitors, and which pages drive the most interest.
How Analytical Dashboards Help Different Industries
An Analytical Dashboard is versatile enough for any industry — here are just a few examples:
– Retail & eCommerce
Retailers and online stores rely on Sales Dashboards to track revenue, monitor best-selling products, and manage store traffic. A Smart Sales Admin Panel with Bootstrap Admin HTML helps store owners keep everything in one place — from orders to customer trends.
– Finance
Banks and financial institutions use Analytical Dashboards to monitor KPIs like new account openings, transactions, loan performance, and regional branch metrics. Real-time Analytical Charts help decision-makers stay ahead.
– Marketing Agencies
Agencies use Analytical Dashboards to track ad impressions, conversions, and client ROI. A good Admin Dashboard UI Kit lets them create custom views for different clients.
– Healthcare
Hospitals and clinics can use dashboards to monitor patient admissions, resource allocation, or appointment trends. A responsive Bootstrap Admin Dashboard ensures secure, real-time access across devices.
– Education
Schools and universities can use Admin Templates to track student enrollments, course completions, and performance trends across branches.
Advantages of Using Analytical Dashboards
Here’s why industries keep investing in Analytical Dashboards built on a strong UI Framework and Bootstrap Admin Template:
✅ Data-Driven Decisions: Get actionable insights without sifting through spreadsheets.
✅ Time Savings: Automated reports and real-time updates mean less manual work.
✅ Better Collaboration: Teams can share dashboards to align on goals.
✅ Scalability: With a flexible Bootstrap Admin HTML structure, you can add new widgets as you grow.
✅ Customization: A quality Admin Dashboard UI Kit lets you match the design to your brand.
FAQs
- What is an Analytical Dashboard?
It’s a visual tool with Analytical Charts that shows your key business metrics in real time.
- Why should I use a Bootstrap Admin Template?
A Bootstrap Admin Dashboard ensures your dashboard is responsive, customizable, and built on a trusted UI framework.
- Is it useful for small businesses?
Yes! Even small teams benefit from clear Sales Dashboards and easy-to-understand data.
- How often is the data updated?
Most modern Analytical Dashboards offer real-time or daily updates.
- Can I customize the widgets?
Absolutely — a good Admin Dashboard UI Kit or Bootstrap Admin HTML makes customization simple.
Final Thoughts
An Analytical Dashboard is one of the smartest investments you can make for your business in 2025. From tracking sales to understanding customer trends, the right dashboard template helps you stay ahead of the competition.
Whether you’re in retail, finance, marketing, or healthcare, using a professional Bootstrap Admin Template gives you the flexibility, security, and modern design you need. Ready to grow smarter? Start with a powerful Analytical Dashboard today!