Turn Data into Decisions with an Analytical Dashboard That Works for You
In today’s fast-paced, data-driven world, businesses are constantly flooded with information. But let’s be honest—making sense of all that data and turning it into something useful? That’s not easy. That’s exactly why an Analytical Dashboard is such a game-changer.
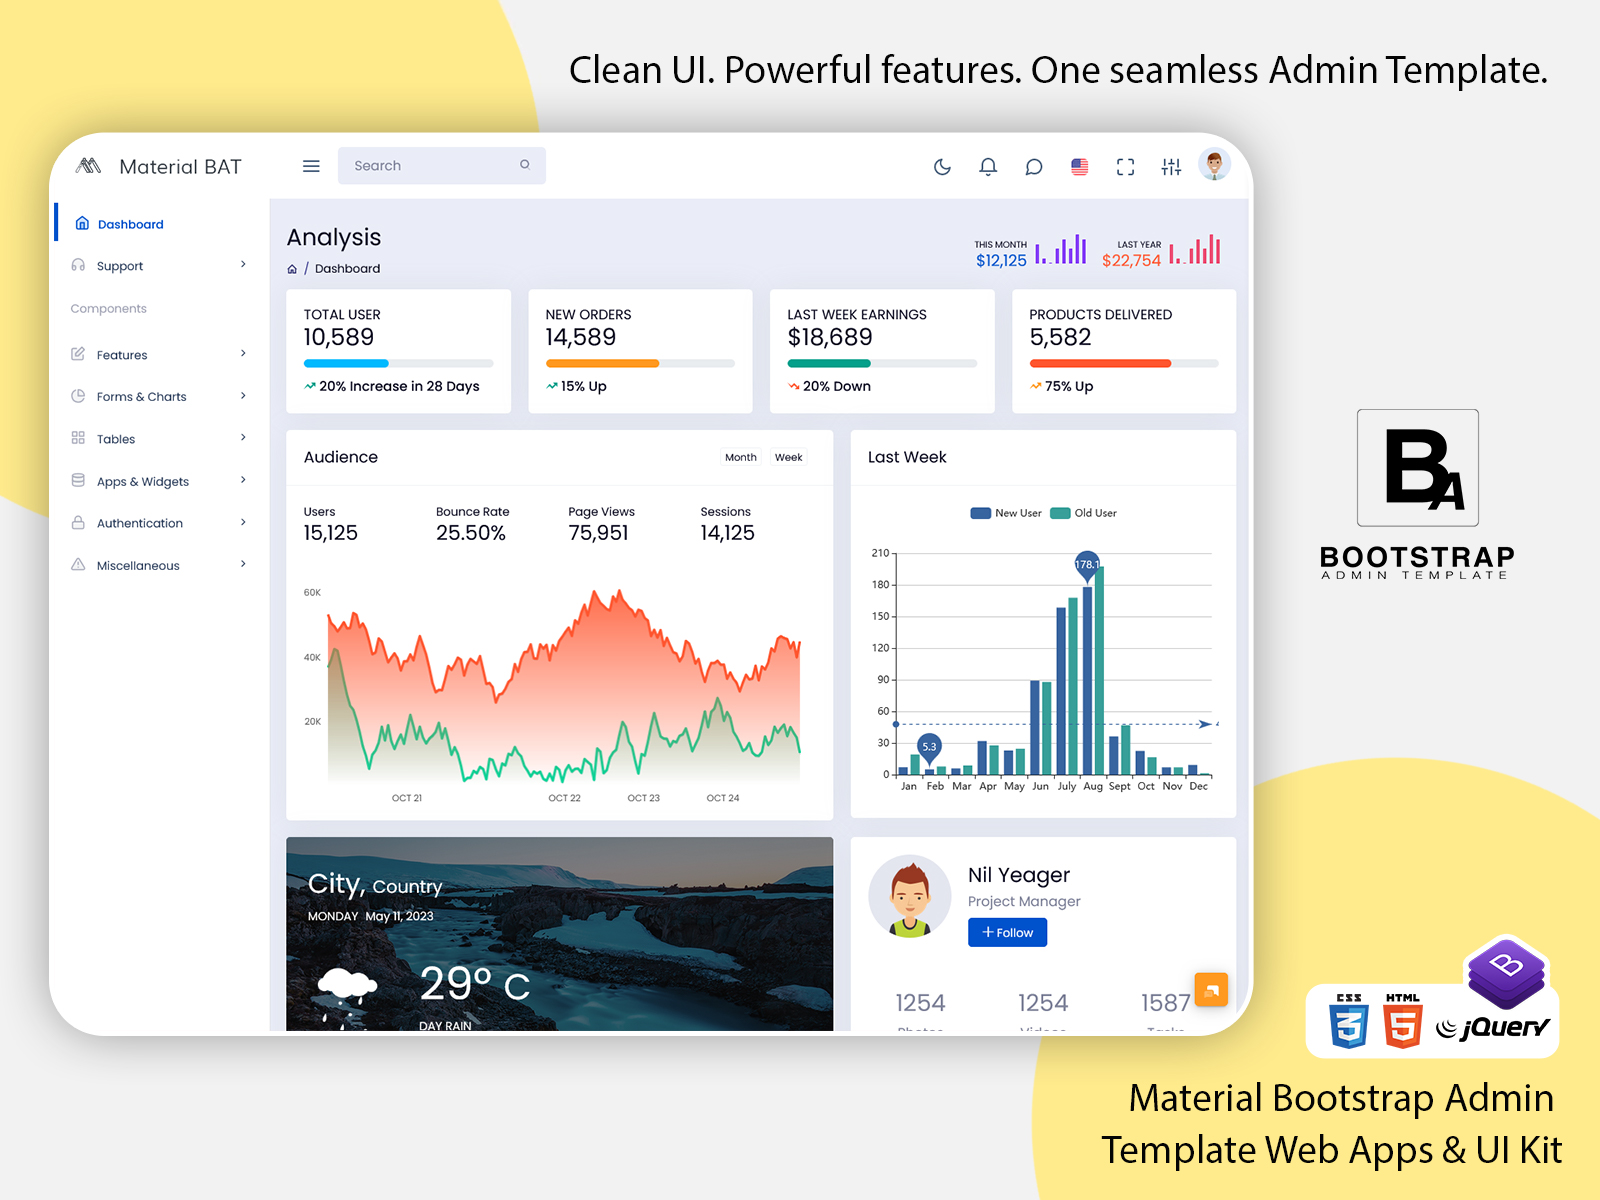
Think of it as your business’s command center. Instead of sifting through endless spreadsheets or switching between reports, a well-designed dashboard brings everything together in one place. It gives you a clear, visual snapshot of your key performance indicators (KPIs), trends, and metrics—so you can see what’s working, what’s not, and where to go next.
At its core, an analytical dashboard turns complex data into easy-to-understand visuals. With interactive charts and graphs, it helps teams quickly spot patterns and make smart decisions—without needing to be a data expert.
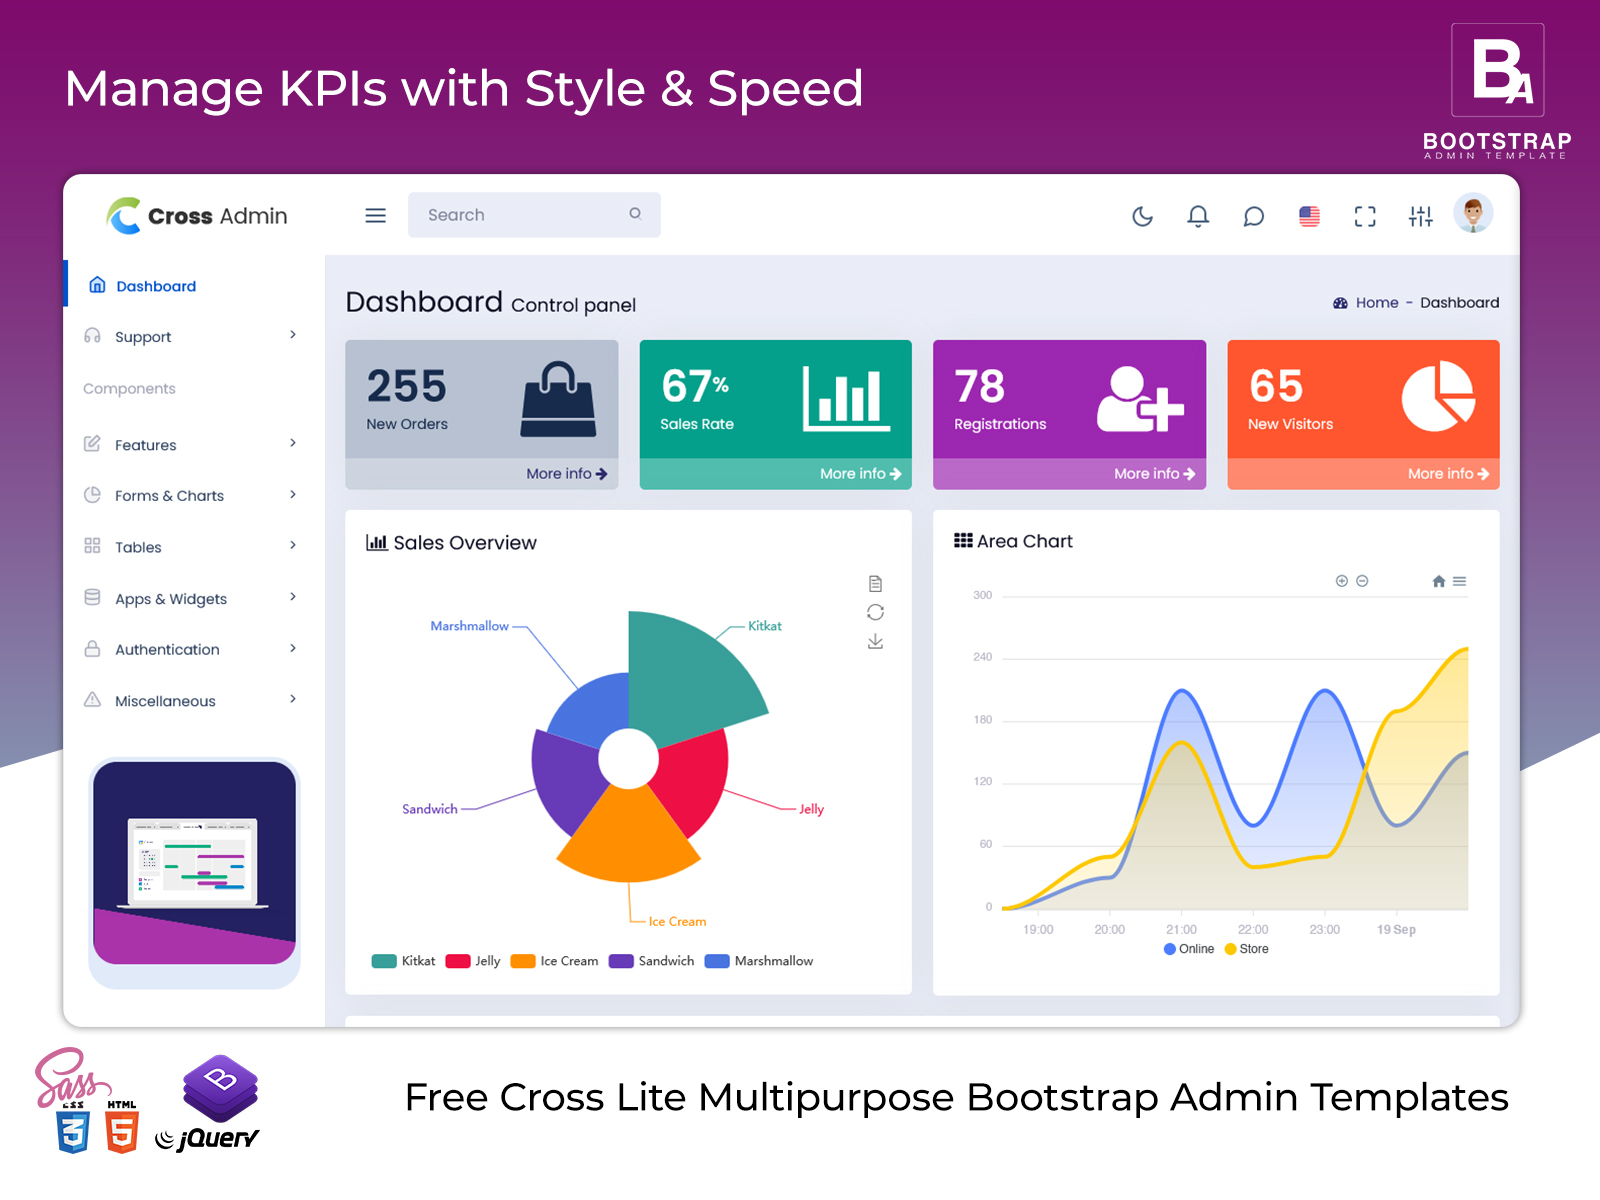
Analytical Dashboard of Cross Lite Admin

MORE INFO / BUY NOW DEMO
Everything You Need, All in One Place
What makes a great dashboard stand out is how it’s built. A clean layout and intuitive interface are essential. You want something that’s easy to navigate, where the most important info is front and center. That’s where our Dashboard UI comes in. Designed using powerful frameworks like Bootstrap Admin Templates, it’s not just functional—it’s user-friendly, responsive, and looks great on any device.
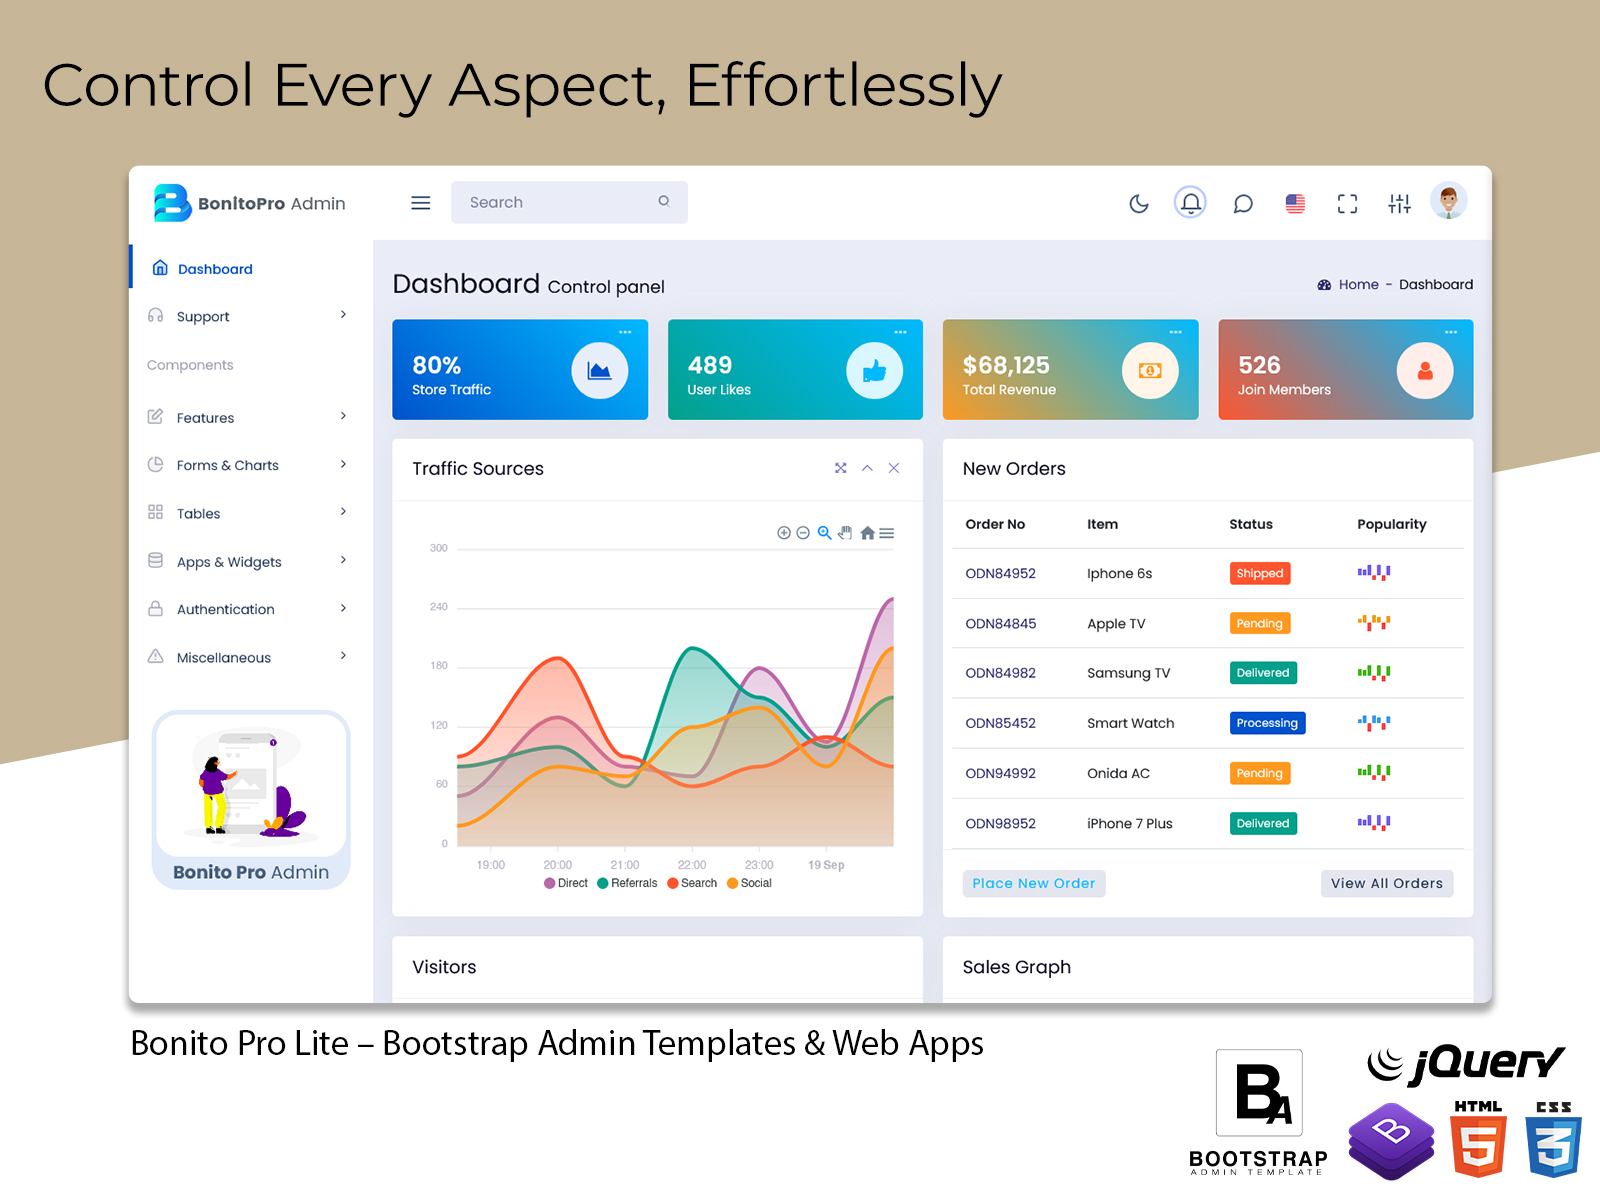
Our Dashboard Analytics features let you dig deeper. Click on a data point to see more. Explore trends. Find what’s driving your numbers. It’s interactive and designed to put control in your hands.
E- Commerce Product Page
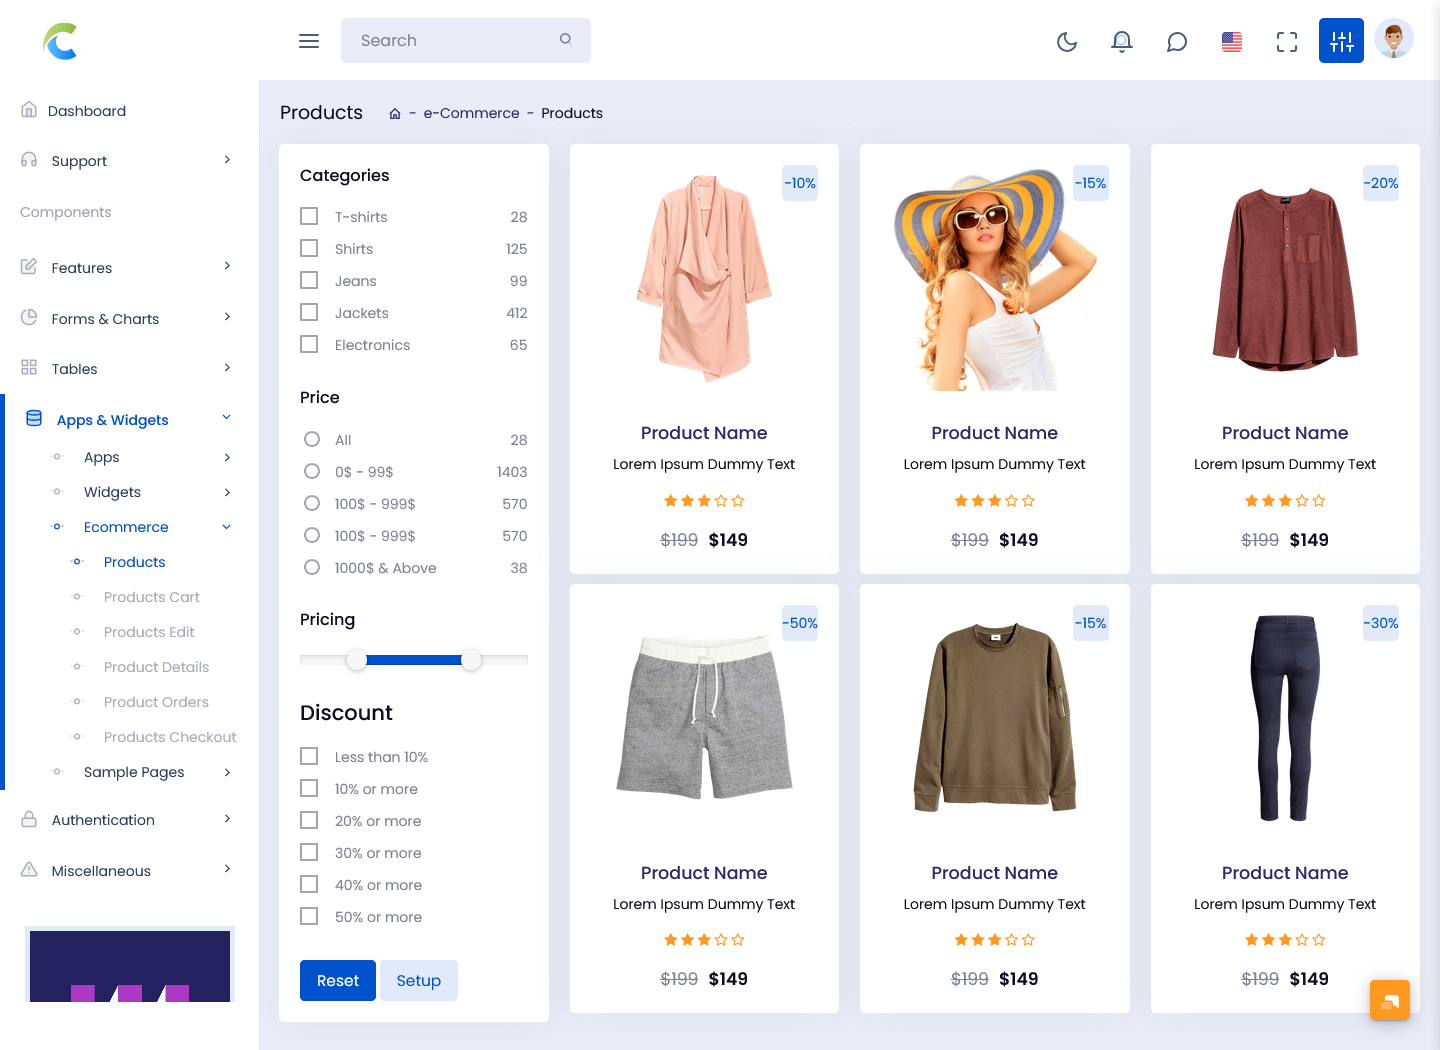
MORE INFO / BUY NOW DEMO
Visualizations That Tell the Whole Story
We’ve built our dashboard with a range of dynamic, insightful charts to help you stay ahead:
-
Sales Overview Chart
Quickly track your sales performance, compare numbers against targets, and identify trends at a glance. -
Area Chart
Ideal for spotting growth or dips over time—whether it’s customer signups, website traffic, or revenue. -
Monthly Recap Report Chart
Get a clear summary of your monthly performance, side-by-side comparisons, and patterns that keep coming up. -
Site Traffic Chart
See when your audience is most active, what pages they love, and how your campaigns are performing. -
Monthly Income
A straightforward, visual snapshot of your earnings so you can easily track progress toward your revenue goals.
Built for Real Business Needs
Great design is just the start. We also know how important support and communication are for your team. That’s why we’ve included:
-
A dedicated Support Ticket Page to track and resolve issues quickly.
-
An integrated Chat Page so team members can collaborate and solve problems in real-time, right inside the dashboard.
Smarter Decisions Start Here
Our Analytical Dashboard is more than just a bunch of charts—it’s a strategic tool that helps you turn raw data into real results. With a modern, responsive design and easy-to-use layout, it fits perfectly into your daily workflow. No more guesswork. Just clear insights, better decisions, and a smoother path to growth.
If you’re ready to take control of your data and put it to work, our dashboard has everything you need to move forward—confidently and efficiently.
Buy Now and Get Started Today!
Click below to purchase and start unlocking the full potential of your business!
BUY NOW