UI Dashboard – Your Key to Better Business Performance
Managing and analyzing data has become integral to making informed decisions, optimizing operations, and improving customer satisfaction. One tool that has become essential for businesses across industries is the UI Dashboard. A UI Dashboard (User Interface Dashboard) is a visual interface that aggregates and displays essential business metrics in one place. It consolidates data from various sources and departments, presenting it in a clear, easy-to-understand format. Whether you’re a business owner, manager, or marketing professional, the purpose of a UI Dashboard is to help users quickly access, analyze, and interact with key data, allowing for faster decision-making and improved performance.
BUY NOW
Minimal Pro Admin – Dashboards
Responsive Bootstrap 5 Admin

MORE INFO / BUY NOW DEMO
Mini Sidebar Dashboard

MORE INFO / BUY NOW DEMO
Chat App

MORE INFO / BUY NOW DEMO
Draggable Portlets

A Dashboard UI is typically customizable, allowing users to modify the interface according to their specific needs, preferences, and goals. Whether used for tracking sales, website traffic, customer interactions, or marketing campaigns, UI Dashboards streamline data monitoring, making it easy to keep track of business performance in real-time.
A UI Dashboard serves as a powerful tool for businesses by centralizing critical data and offering real-time insights into various key metrics. One of its primary uses is to track and visualize performance across multiple business areas, such as sales, marketing, inventory, and customer engagement. For example, sales teams can easily access information about monthly sales figures, conversion rates, and top-performing products, while marketing teams can monitor campaign performance and website traffic. This centralized access to real-time data allows businesses to stay on top of key developments, identify potential issues early, and make data-driven decisions quickly, leading to better overall efficiency and performance.
Another significant use of a UI Dashboard is in enhancing decision-making and collaboration across teams. By providing a comprehensive overview of the business’s operations, team members at all levels—from managers to analysts—can easily identify trends, opportunities, and areas for improvement. For example, the Store Traffic and Top Locations features allow businesses to analyze customer behavior, while Recently Products and User Likes help assess product performance. These insights not only guide strategic planning but also improve cross-departmental collaboration, as everyone has access to the same up-to-date data. In this way, a UI Dashboard ensures that businesses remain agile, responsive, and informed, empowering teams to act on valuable insights with speed and accuracy.
Key Components of a UI Dashboard
A UI Dashboard can include various sections and metrics depending on the needs of the business. From sales to customer behavior, the dashboard can help businesses track and analyze critical data at a glance. Let’s dive into some of the common components you can expect in a well-designed UI Dashboard:
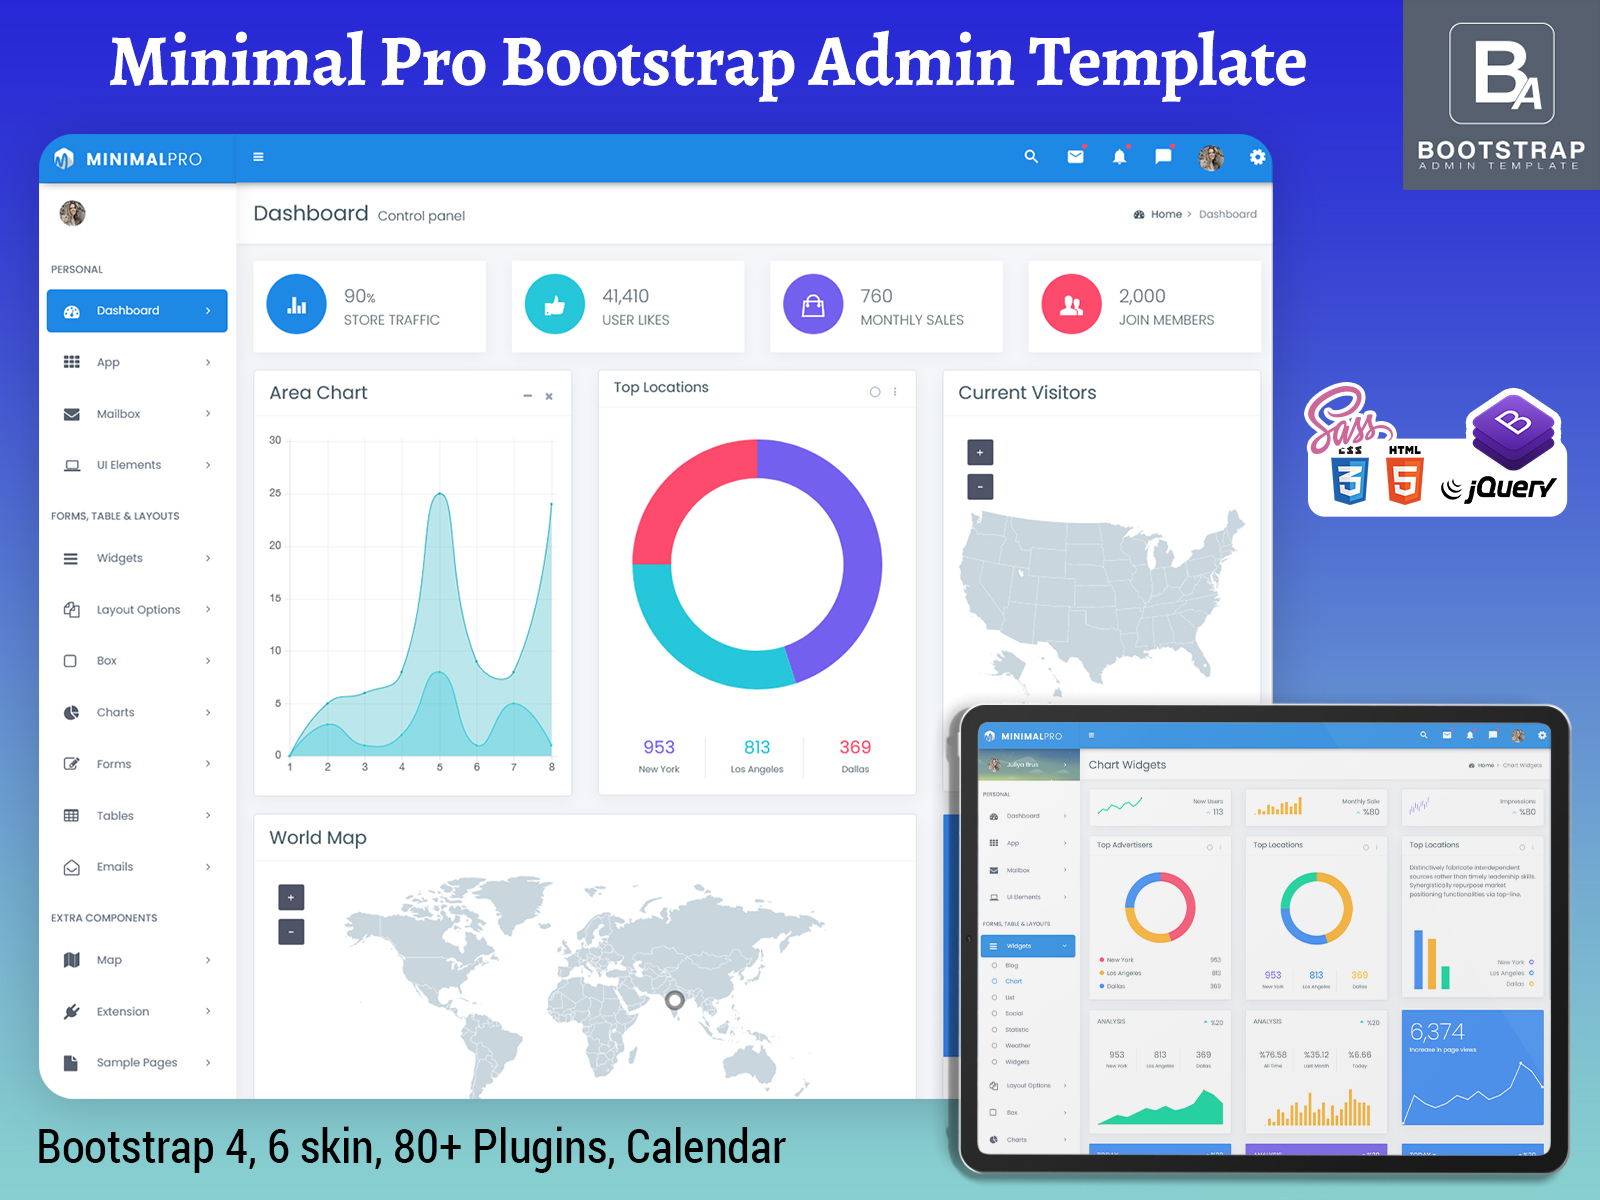
1. Store Traffic
The Store Traffic section of the UI Dashboard provides insights into the number of visitors to your physical or online store. This section can display metrics such as the number of daily visitors, traffic sources, and the geographic locations of your customers. By analyzing this data, businesses can identify trends, adjust marketing strategies, and optimize customer engagement.
Tracking Store Traffic is especially important for e-commerce businesses or brick-and-mortar stores that rely on foot traffic. Understanding the patterns and behavior of visitors helps improve store layout, product placement, and marketing efforts.
2. User Likes
The User Likes section tracks the interactions and preferences of your customers or website visitors. It shows how many people liked or shared your products, blog posts, or other content across social media platforms or your website. Understanding which products or posts resonate most with your audience helps in refining marketing efforts and product development.
This section is vital for businesses looking to improve their digital presence and user engagement. Social media interactions, such as likes and shares, often translate to increased brand visibility and can help boost sales.
3. Monthly Sales
The Monthly Sales section provides an overview of sales performance over the current month. It shows total sales, revenue, and growth compared to previous months or quarters. By tracking Monthly Sales, businesses can evaluate their sales strategies, identify peak seasons, and forecast future growth. This data is essential for inventory management, pricing strategies, and revenue projections.
For businesses with multiple sales channels, this section can break down sales performance by region, product category, or sales team, offering more granular insights into sales trends.
4. Join Members
The Join Members section tracks the number of new members or customers who have signed up for your service, product, or subscription. This section may include data on how many new users registered during a given period, as well as demographic information such as age, location, and purchase history.
This data is invaluable for businesses with membership or subscription models. By tracking new member sign-ups, businesses can identify growth patterns and create targeted marketing campaigns to attract more members.
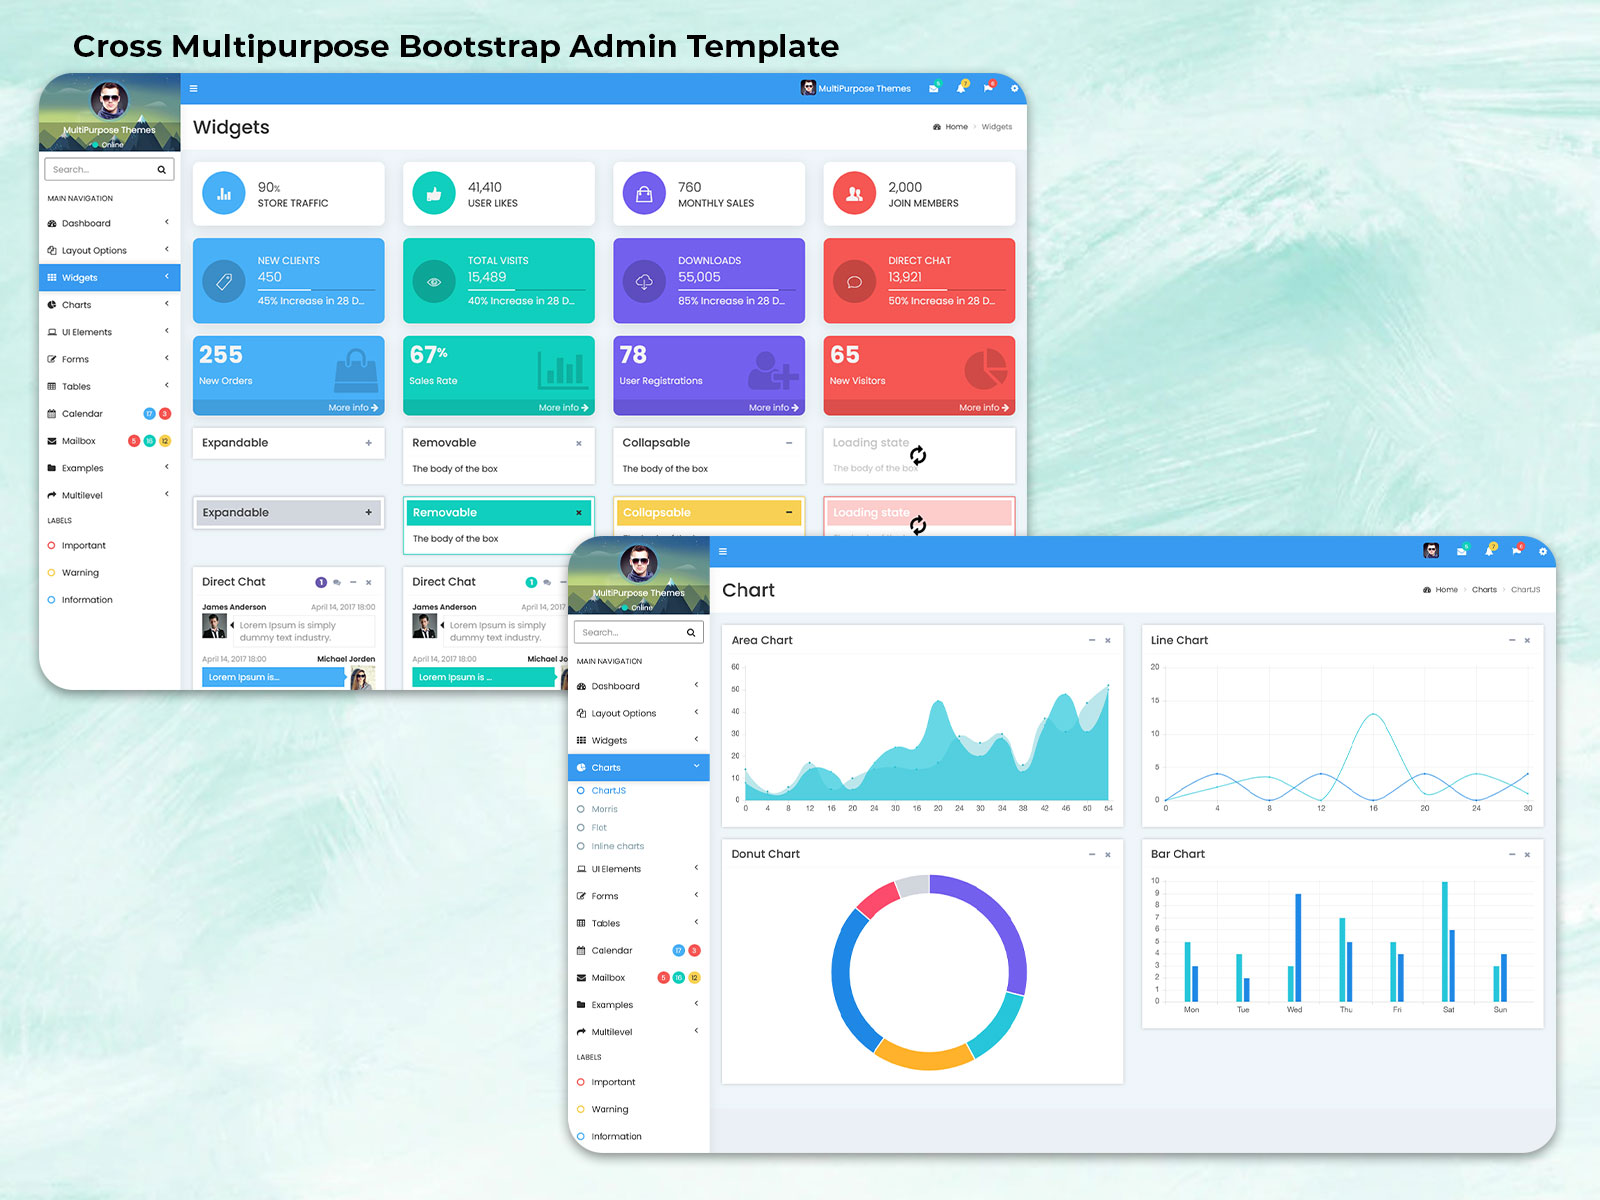
5. Area Chart
An Area Chart is often used in bootstrap admin template to display trends over time. This visual representation helps businesses track metrics such as sales, website visits, or customer satisfaction across different time periods. The area chart uses shading to show the total value over time, making it easy to visualize changes and trends.
By adding an Area Chart to the UI Dashboard, businesses can spot trends, compare performance metrics, and identify areas that require improvement. For instance, an area chart showing sales over the past six months can help businesses identify seasonal sales fluctuations and adjust marketing efforts accordingly.
6. Top Locations
The Top Locations section provides insights into where your customers are located. Whether you have an online business or a physical store, knowing which locations generate the most traffic or sales is crucial for optimizing marketing campaigns and allocating resources effectively.
This data can also help businesses tailor their product offerings or marketing messages to specific locations. For example, if a business sees high traffic from a particular city, it could target that region with localized promotions or advertisements.
7. Recently Viewed Products
The Recently Viewed Products section tracks which products customers have recently viewed or interacted with. This data helps businesses identify customer interests and behavior patterns, allowing them to make personalized recommendations and optimize product offerings.
For e-commerce websites, showing Recently Viewed Products on the homepage or product pages encourages customers to revisit items they were interested in. This simple feature can lead to higher conversion rates and increase sales by reminding customers of their previous interests.
8. Our Visitors
The Our Visitors section tracks key metrics related to website visitors, such as unique visitors, page views, and time spent on the site. It may also show user demographics, device types, and bounce rates, providing a comprehensive understanding of website engagement.
By analyzing visitor data, businesses can assess the effectiveness of their website design, content, and marketing campaigns. Improving the visitor experience can lead to longer engagement times, increased conversions, and improved customer satisfaction.
9. Quick Email
The Quick Email feature allows users to send or receive emails directly from the UI Dashboard. This functionality enables team members to stay in touch with customers, vendors, or internal stakeholders while managing dashboard tasks. Quick communication helps improve response times, customer service, and internal collaboration.
Whether it’s reaching out to a customer about an order or sending a quick update to the marketing team, the Quick Email feature streamlines communication within the UI Dashboard.
Why is a UI Dashboard Important?
In today’s data-driven business world, a UI Dashboard is essential for managing and analyzing key metrics that impact business decisions. Here’s why investing in a UI Dashboard is crucial for your business:
1. Centralized Data Access
One of the biggest advantages of a UI Dashboard is that it centralizes all important data in one place. Instead of relying on spreadsheets, reports, and multiple systems, a Dashboard UI brings together data from different departments such as sales, marketing, and customer service into a single, unified interface. This centralization makes it easier for decision-makers to monitor performance and make informed choices.
With the use of a Master Dashboard or Admin Dashboard UI, businesses can efficiently access real-time data and keep track of performance across various sectors without unnecessary complexity.
2. Real-Time Insights
A UI Dashboard provides real-time insights into the data that matter most. This is especially valuable for businesses that operate in fast-paced environments where quick decisions are necessary. By displaying live data, businesses can stay ahead of trends, identify potential issues before they escalate, and respond proactively to market changes.
Whether it’s sales, customer feedback, or website traffic, real-time insights allow businesses to react quickly to improve performance.
3. Improved Decision-Making
A well-designed UI Dashboard simplifies the decision-making process by presenting critical data in a clear and accessible manner. Whether you’re a business owner, manager, or marketing professional, having access to real-time information helps you make more informed, data-driven decisions. For instance, if sales are declining in a particular region, you can quickly identify the issue and implement targeted strategies to address it.
Admin Templates, such as the Bootstrap Admin Panel make it easier for businesses to access the data they need and act on it immediately.
4. Increased Efficiency and Productivity
By having all the key metrics in one place, employees don’t have to waste time searching for data across different systems or spreadsheets. This enhances productivity and allows teams to focus on more strategic tasks that add value to the business. The time saved by using a UI Dashboard can be redirected to activities such as customer engagement, sales, and marketing.
5. Customization and Scalability
A significant advantage of UI Dashboards is that they are customizable. With tools like Bootstrap Admin Theme and Bootstrap Admin Template, businesses can tailor the dashboard to their unique needs. As your business grows, the dashboard can scale to accommodate new metrics, data points, and functionalities.
Whether you need a Master Dashboard or a more advanced Admin Dashboard UI, these dashboards are designed to grow with your business, ensuring that the insights you need remain accessible and relevant over time.
Conclusion: Buy Now and Enhance Your Business
In conclusion, a UI Dashboard is a vital tool for businesses looking to stay ahead of the competition by managing their data and making informed decisions. By offering real-time insights into key metrics such as sales, traffic, and customer behavior, UI Dashboards empower businesses to improve performance, optimize strategies, and increase profitability.
With a wide range of customizable options available—such as Bootstrap Admin Templates, Dashboard Templates, and Admin Panel tools—businesses can easily implement a solution that fits their unique needs. The ability to monitor and act on data in real-time improves decision-making, boosts productivity, and enhances customer satisfaction.
If you’re ready to take your business to the next level, it’s time to invest in a UI Dashboard that will streamline your operations, improve your performance, and help you make smarter, data-driven decisions. Buy now and unlock the potential of your business with the power of a UI Dashboard.
Buy Now and Get Started Today!
Click below to purchase and start unlocking the full potential of your business!
BUY NOW