The Bootstrap Admin Template – Features, Benefits, and Users
In today’s data-driven world, businesses are constantly seeking ways to harness information for better decision-making. One of the most effective tools for achieving this is the Bootstrap Admin Template . This powerful tool provides a centralized interface for tracking key performance indicators (KPIs), visualizing data trends, and generating actionable insights.
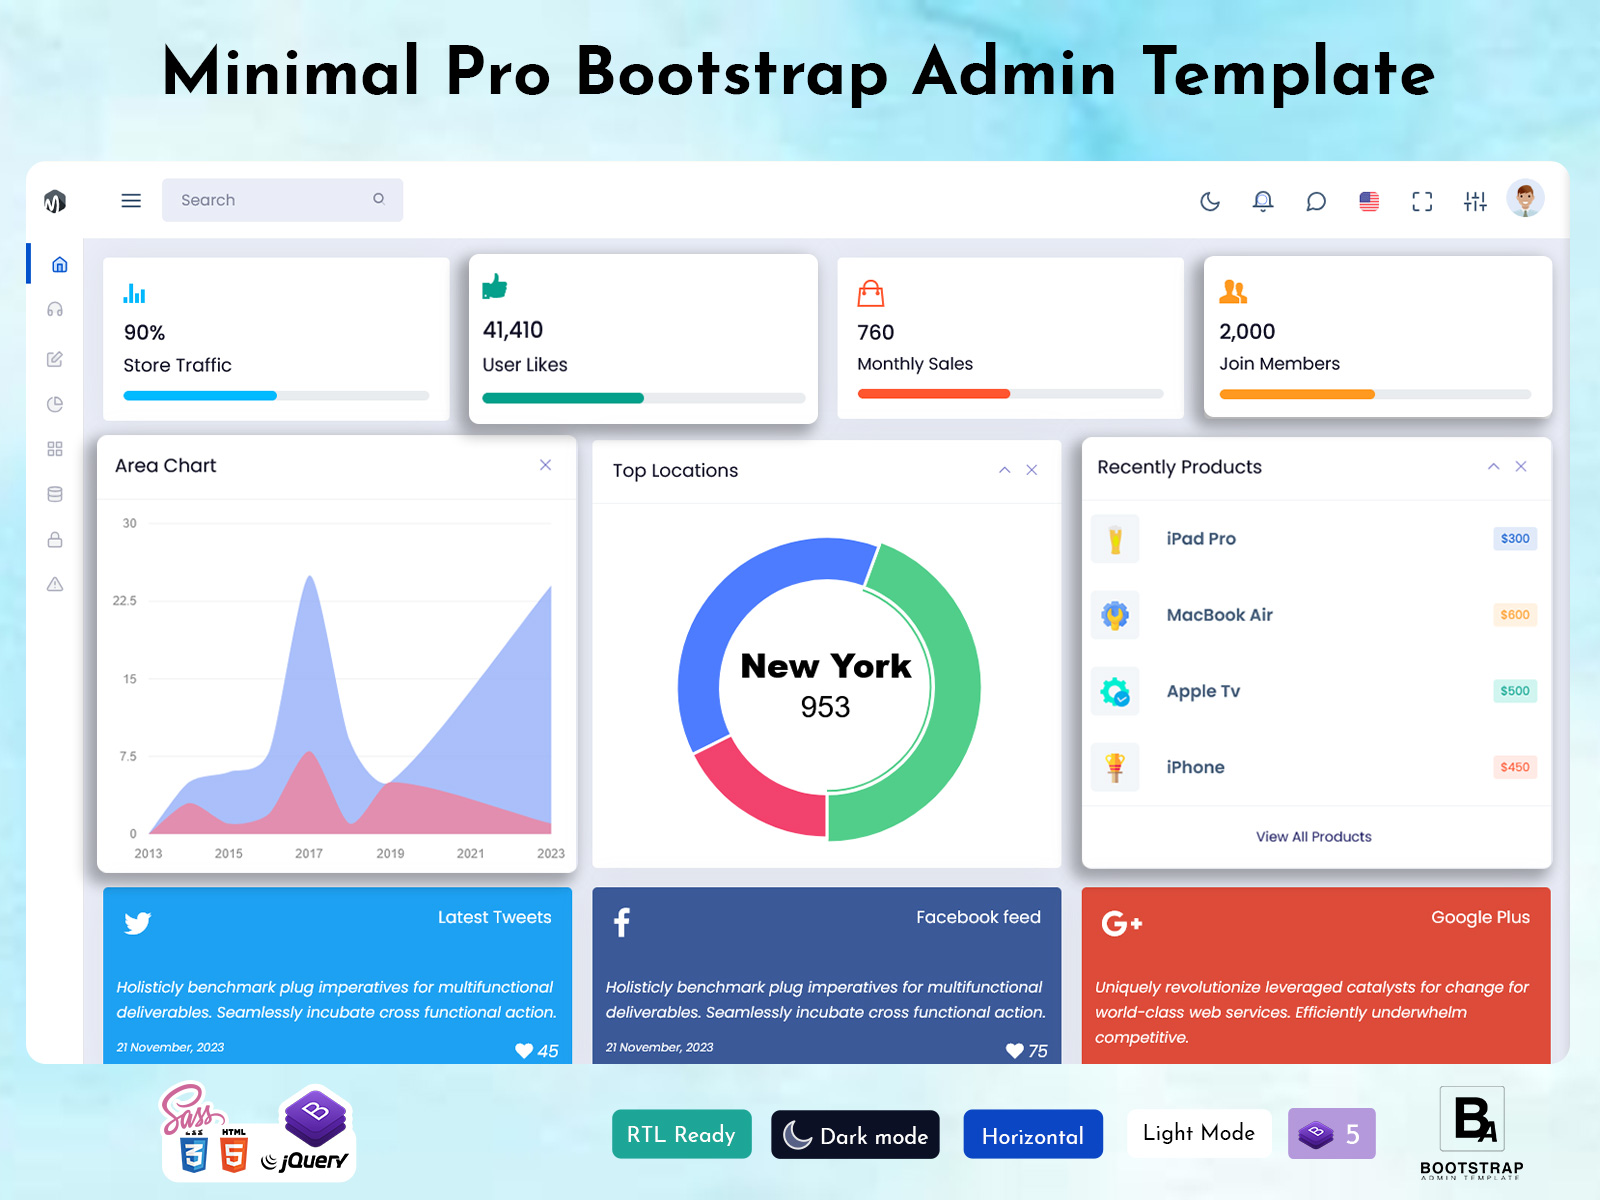
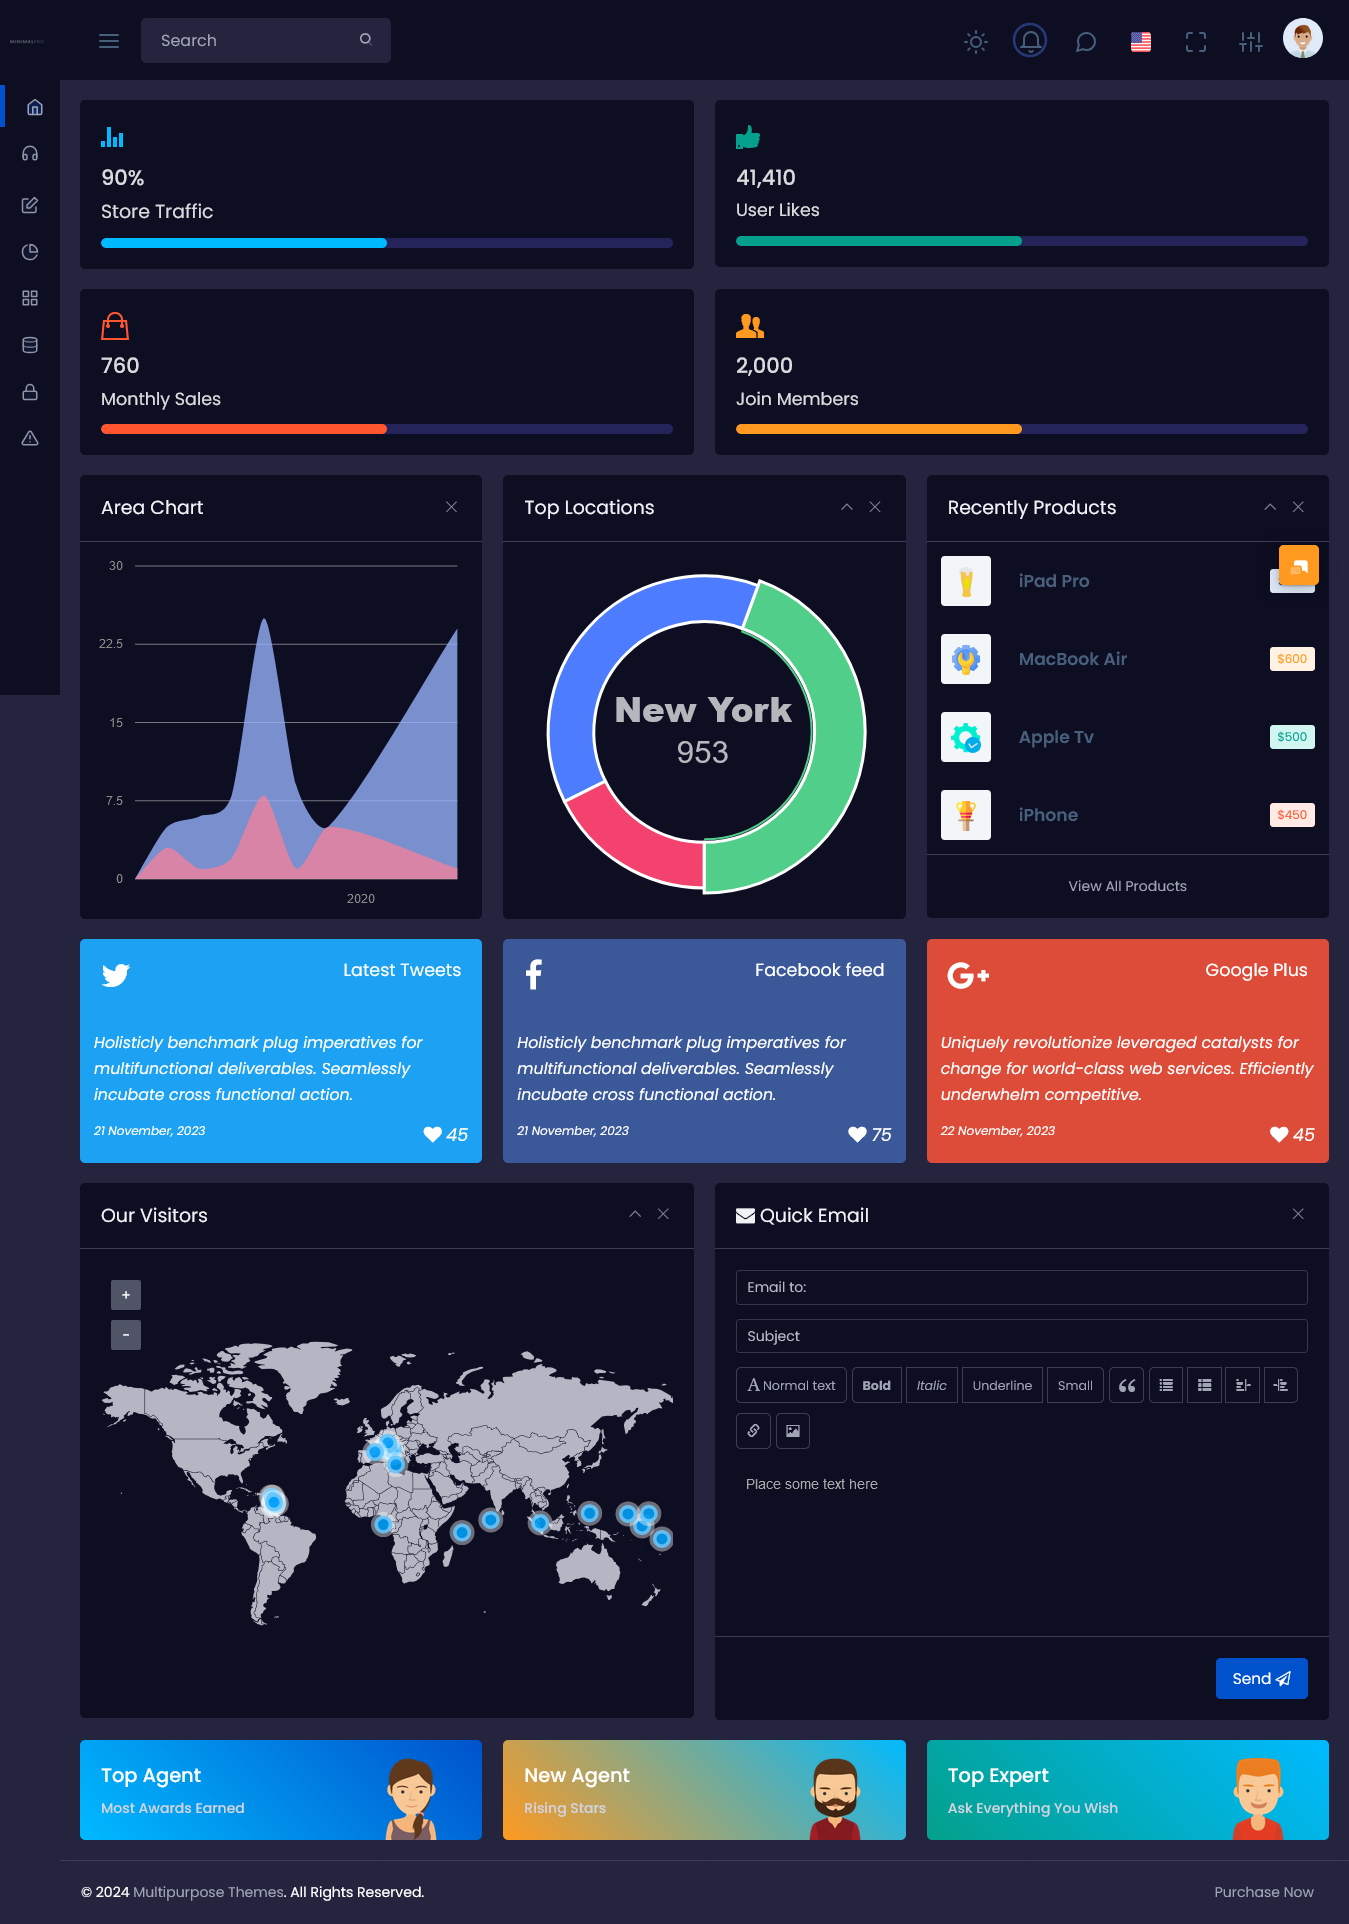
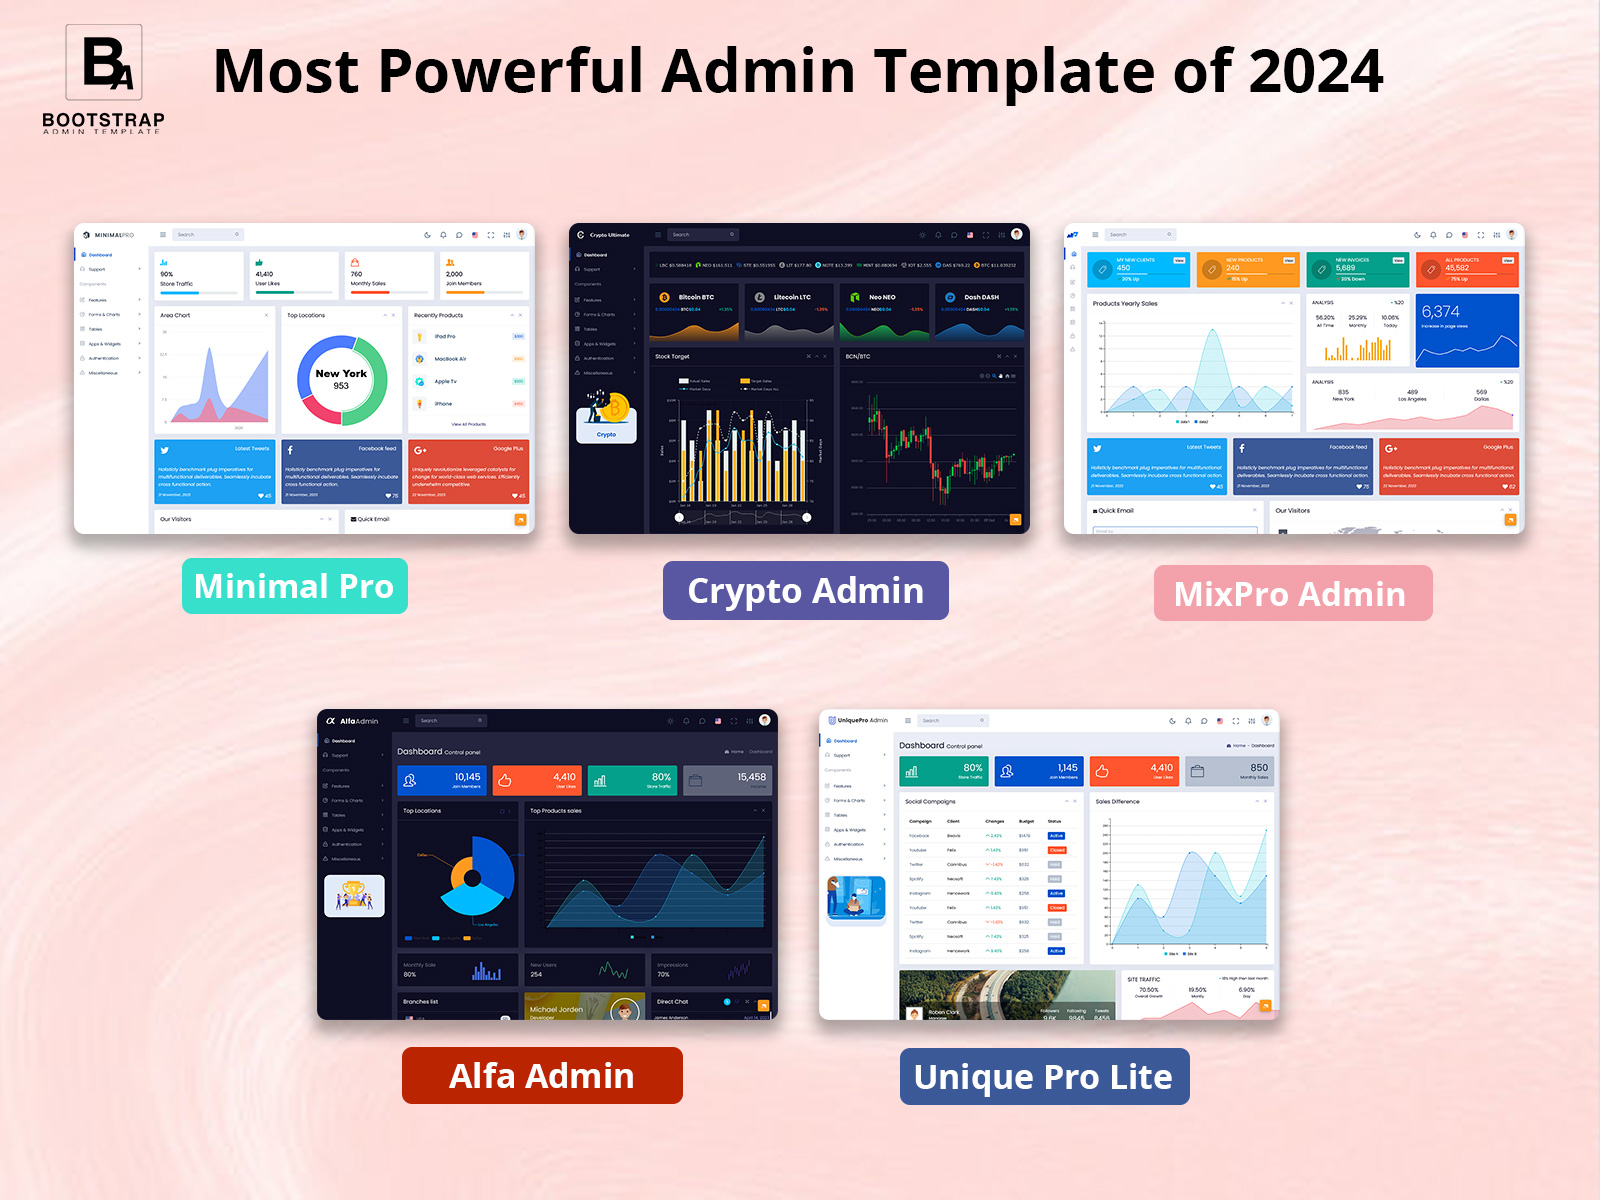
Minimal Pro Admin
BUY NOW
What is an Analytics Dashboard?
An Analytics Dashboard is an interactive, visual representation of data that aggregates multiple metrics into a single view. It serves as a crucial tool for organizations looking to monitor performance, evaluate strategies, and understand customer behavior. This type of Bootstrap Admin Template typically includes features such as Store Traffic, User Likes, Monthly Sales, Join Members, Area Charts, Top Locations, Recently Viewed Products, Visitor Demographics, Support Options, and various forms of data visualization including tables, charts, and widgets.
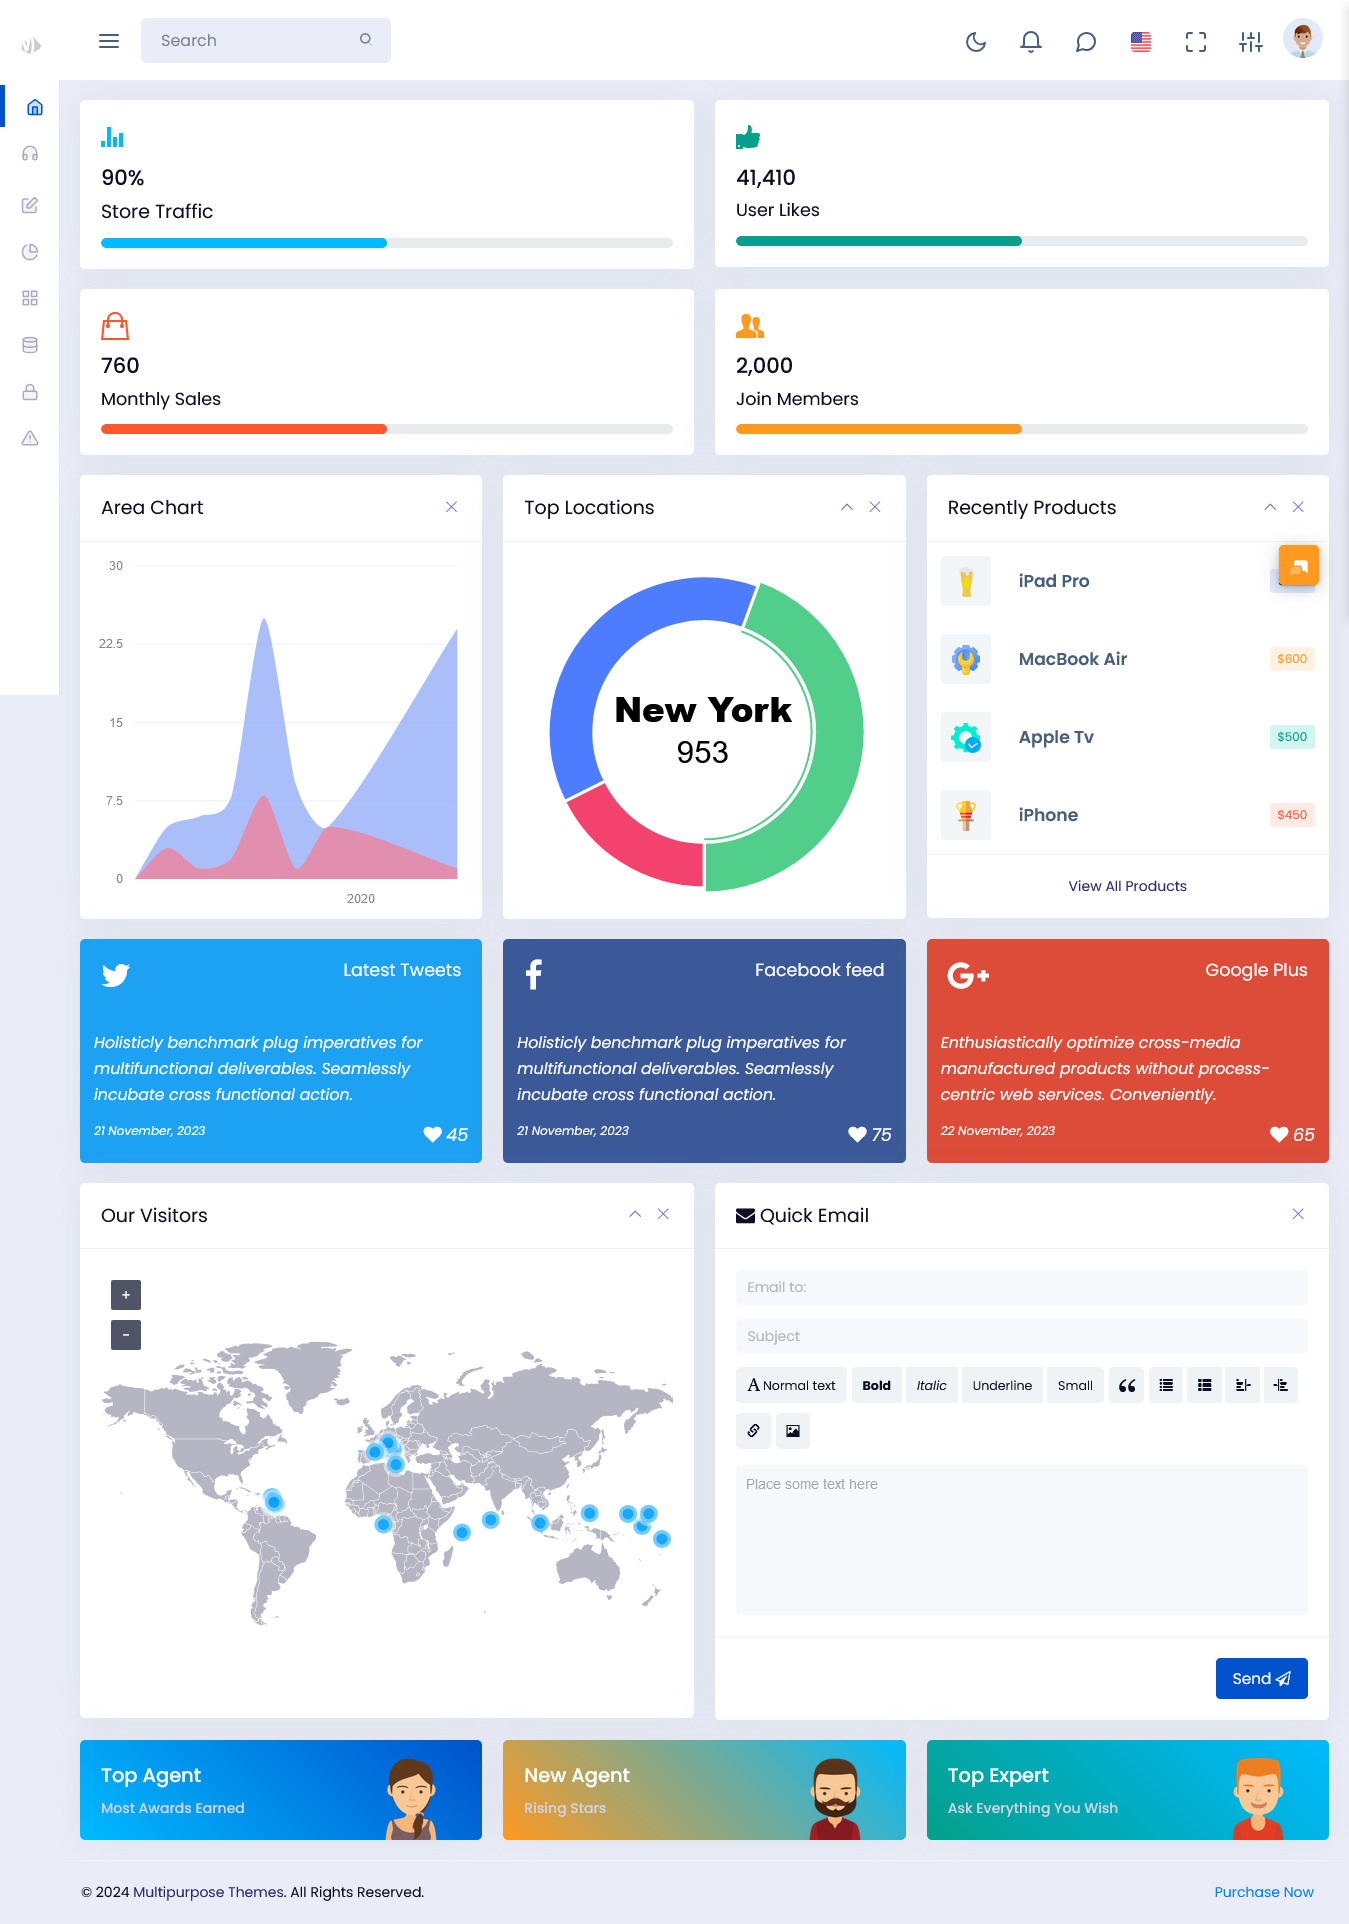
Key Features of an Bootstrap Admin Template
- Store Traffic:
– Displays the number of visitors to your online store or website over a specific timeframe. This feature allows businesses to assess their reach and understand peak traffic times.
- User Likes:
– Tracks the number of likes or positive engagements on products or content, offering insights into customer preferences and satisfaction.
- Monthly Sales:
– Provides an overview of sales performance, allowing businesses to track revenue trends over different months. This metric is critical for evaluating sales strategies and inventory management.
- Join Members:
– Monitors new user sign-ups or memberships, helping businesses understand their growth in terms of customer base.
- Area Chart:
– Visualizes data trends over time, making it easier to spot patterns and fluctuations in metrics like sales or user engagement.
- Top Locations:
– Highlights geographical data about where your users or sales are coming from, which can inform targeted marketing strategies and regional product offerings.
- Recently Viewed Products:
– Displays products that users have recently engaged with, providing insights into customer interests and potential cross-selling opportunities.
- Our Visitors:
– Offers detailed demographics of site visitors, including age, gender, and location, allowing businesses to tailor their offerings accordingly.
- Support Options:
– Lists available customer support channels and resources, ensuring that users can easily access help when needed.
- Forms and Charts:
– Interactive elements for data input and visual representation, making the dashboard user-friendly and informative.
- Different Types of Tables:
– Organizes detailed data in a structured format, allowing for easy comparison and analysis.
- Apps and Widgets:
– Integrates additional functionalities and visual elements to enhance user experience and data interaction.
- Customizable Features:
– Allows users to tailor the Admin Template according to specific needs, ensuring that relevant data is always at their fingertips.
Dashboards of Minimal Pro Admin
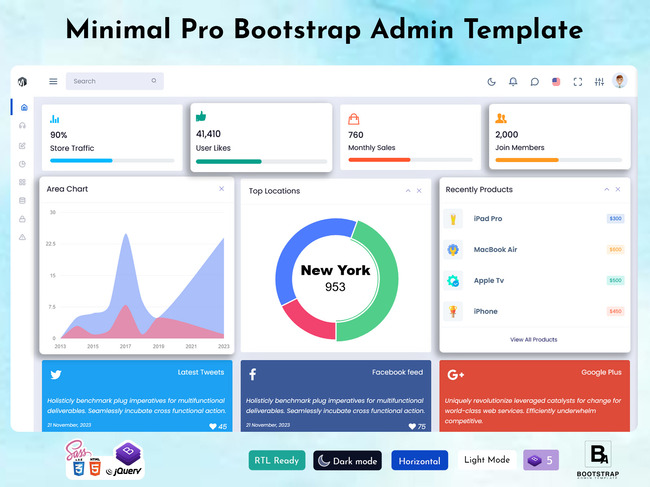
Mini Sidebar Style Dashboard – Light Version
MORE INFO / BUY NOW DEMO
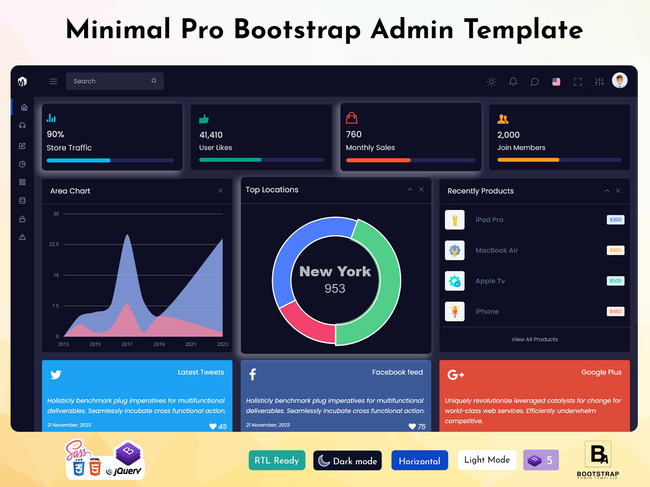
Mini Sidebar Style Dashboard – Dark Version
MORE INFO / BUY NOW DEMO
Who Can Use a Bootstrap Admin Template ?
Analytics Dashboard is versatile tools that can be beneficial across various sectors. Here are some key users:
- Business Executives:
– Leaders and decision-makers can utilize the Bootstrap Admin Template for a quick overview of organizational performance, enabling them to make informed strategic decisions.
- Marketing Teams:
– Marketers can assess campaign performance, user engagement, and customer preferences, allowing them to refine their strategies and maximize ROI.
- Sales Teams:
– Sales professionals can track monthly sales and customer sign-ups, helping them understand their targets and performance in real time.
- Product Managers:
– These individuals can use the Dashboard Template to analyze product engagement and feedback, enabling them to improve existing products and guide new product development.
- Customer Support Teams:
– Support staff can monitor customer queries and issues through the dashboard, allowing them to enhance service quality and responsiveness.
- E-commerce Businesses:
– Online retailers can gain insights into visitor behavior, sales trends, and product popularity, helping them to optimize their offerings and marketing strategies.
Benefits of Using a Bootstrap Admin Template
- Centralized Data Management:
– An Analytics Dashboard consolidates various data points into one location, reducing the time spent searching for information. This centralization enhances productivity and streamlines workflows.
- Real-Time Insights:
– With live data updates, users can access real-time insights, enabling them to react quickly to changing market conditions or user behaviors.
- Data Visualization:
– The use of charts, graphs, and tables makes complex data easier to interpret. Visual representation aids in identifying trends and making sense of large volumes of data.
- Improved Decision-Making:
– By providing a comprehensive view of key metrics, a Bootstrap Admin Template facilitates informed decision-making, reducing reliance on gut feelings and assumptions.
- Enhanced Collaboration:
– Dashboards can be shared across departments, fostering collaboration among teams. Everyone has access to the same data, ensuring that all parties are aligned in their objectives.
- Increased Accountability:
– By making performance metrics transparent, team members can be held accountable for their contributions. This promotes a culture of responsibility and encourages high performance.
- Customizable Experience:
– Users can tailor the Bootstrap Admin Template to focus on metrics that matter most to them, enhancing relevance and usability.
- Historical Analysis:
– Users can compare current data with historical trends, providing valuable context for performance evaluations and strategy adjustments.
Conclusion
A Dashboard Template is an invaluable tool for organizations aiming to leverage data for strategic advantage. With features that allow for in-depth analysis of key metrics, it serves a wide range of users from executives to customer support teams. By centralizing data and providing real-time insights, an Admin Template empowers businesses to make informed decisions, optimize operations, and enhance overall performance.
As organizations continue to navigate a data-rich landscape, the Admin Template will remain a pivotal component in the toolkit for driving success and achieving goals. Whether you are looking to improve sales, enhance user engagement, or optimize marketing strategies, investing in a robust Analytics Dashboard can yield significant benefits for your organization.

This admin template is super easy to use and looks great. It helped us organize our patient data quickly and efficiently. Highly recommend!
I love how simple and clean this dashboard template is. It’s easy to navigate and makes managing our healthcare system a lot smoother.
This bootstrap admin template has everything we need to track patient information, appointments, and vitals. It has improved our workflow significantly.
The design of admin template is modern and intuitive. It’s made patient management at our clinic much faster and more organized. Well worth the investment!
We’ve saved so much time managing patient data with this dashboard template. It’s organized and straightforward, making it easy to track everything.
As a small clinic, this bootstrap admin template is exactly what we needed. It’s simple, affordable, and has all the features to keep things running smoothly.
We love how easy it is to customize this admin template for our specific needs. It gives us control over how we track and manage patient data.
Not only is the dashboard template easy to use, but the support team is amazing. They were quick to respond and help us set things up. Very satisfied!
We’re using this bootstrap admin template in our firm, and it is really good in making the best decisions. It’s become an essential tool for us.
This admin template is perfect for healthcare professionals who need an organized, efficient way to manage patients and appointments. We’re really impressed.