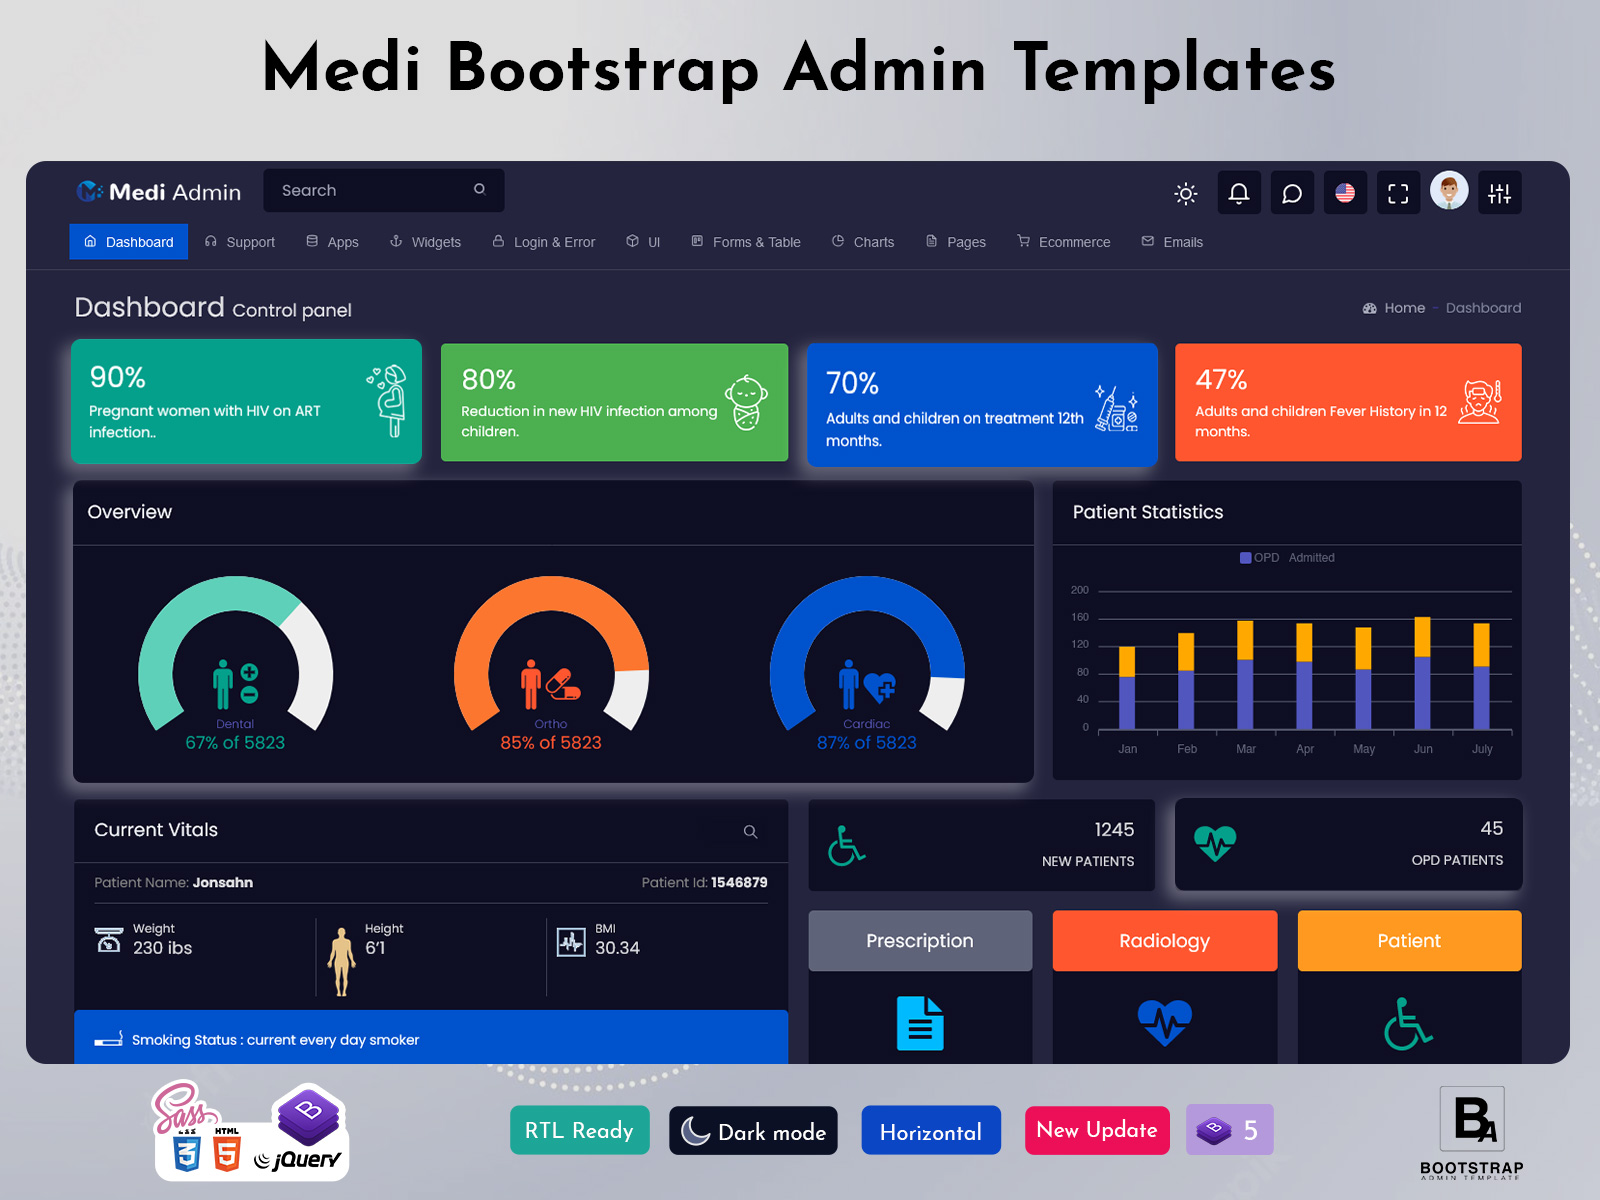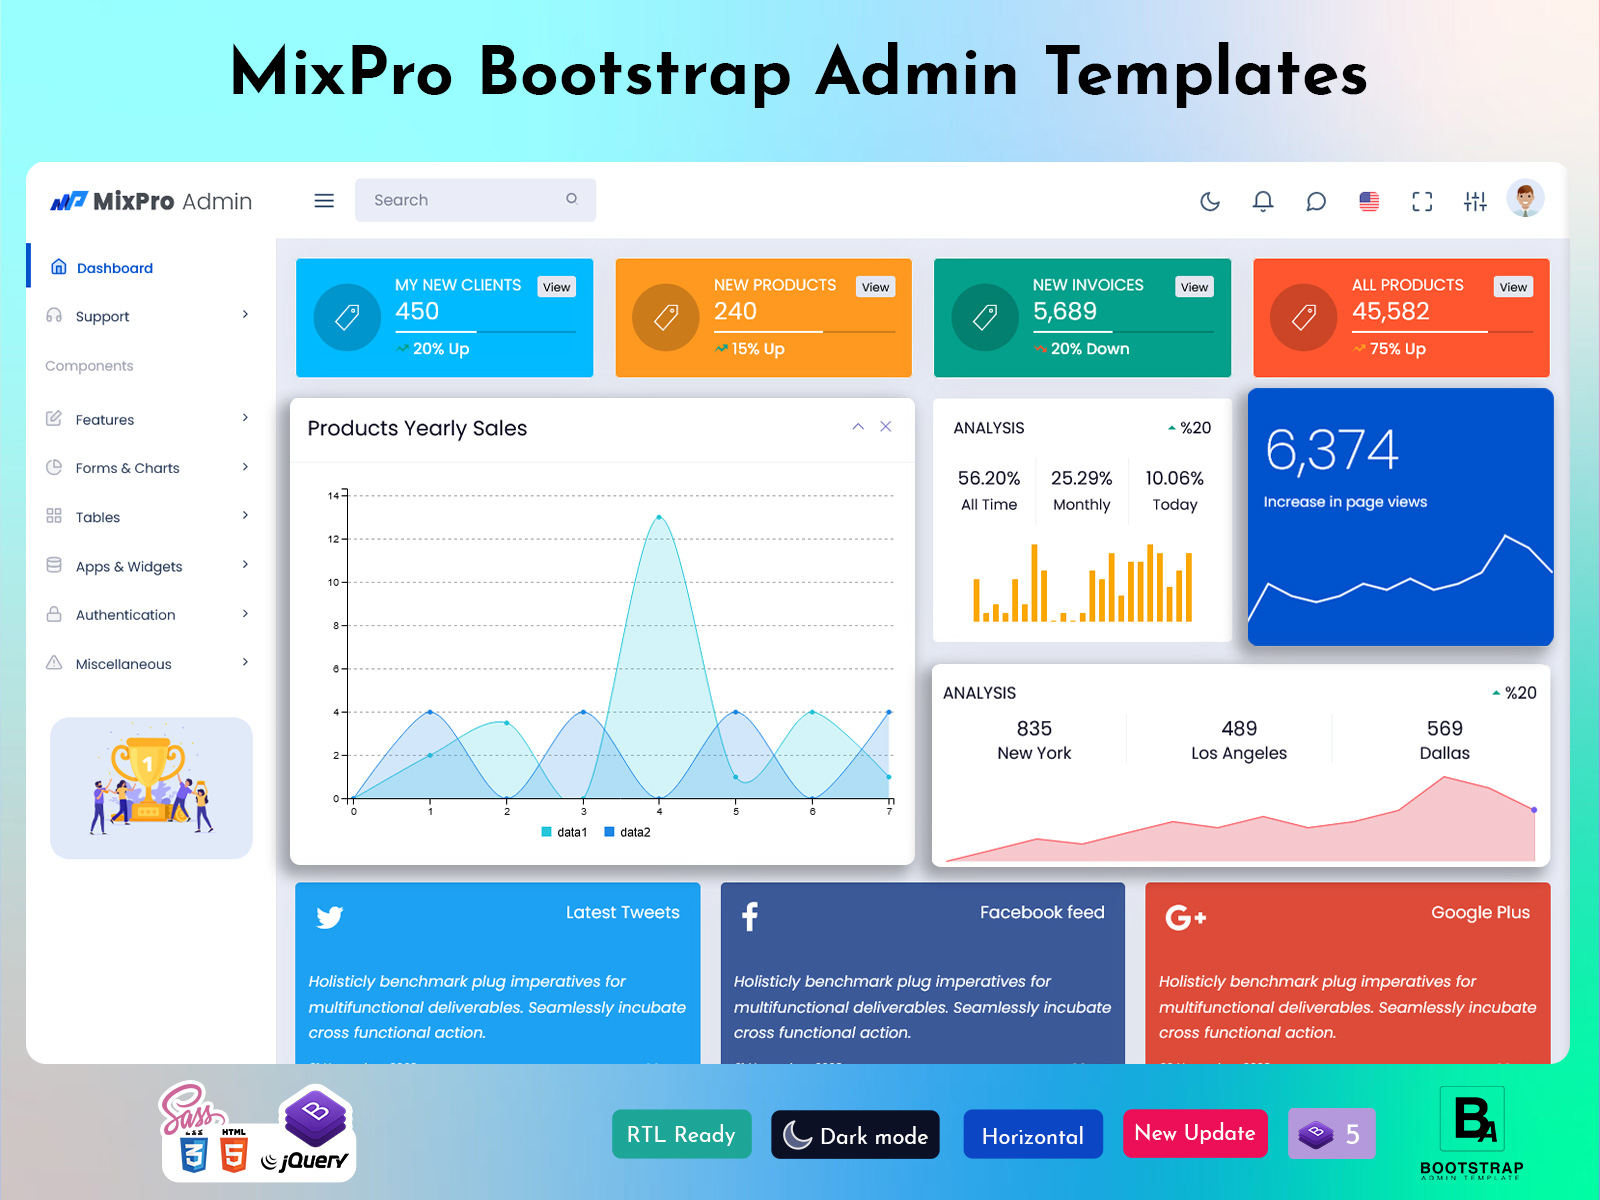
What’s Next? Emerging Trends in Dashboard Template Design
What’s Next? Emerging Trends in Dashboard Template Design
A Dashboard has become an essential tool for businesses, organizations and individuals to visualize data and make informed decisions. As technology advances, so does the design and functionality of dashboard templates. In this blog, we’ll explore emerging trends in dashboard template design, highlighting what to look for in the future.
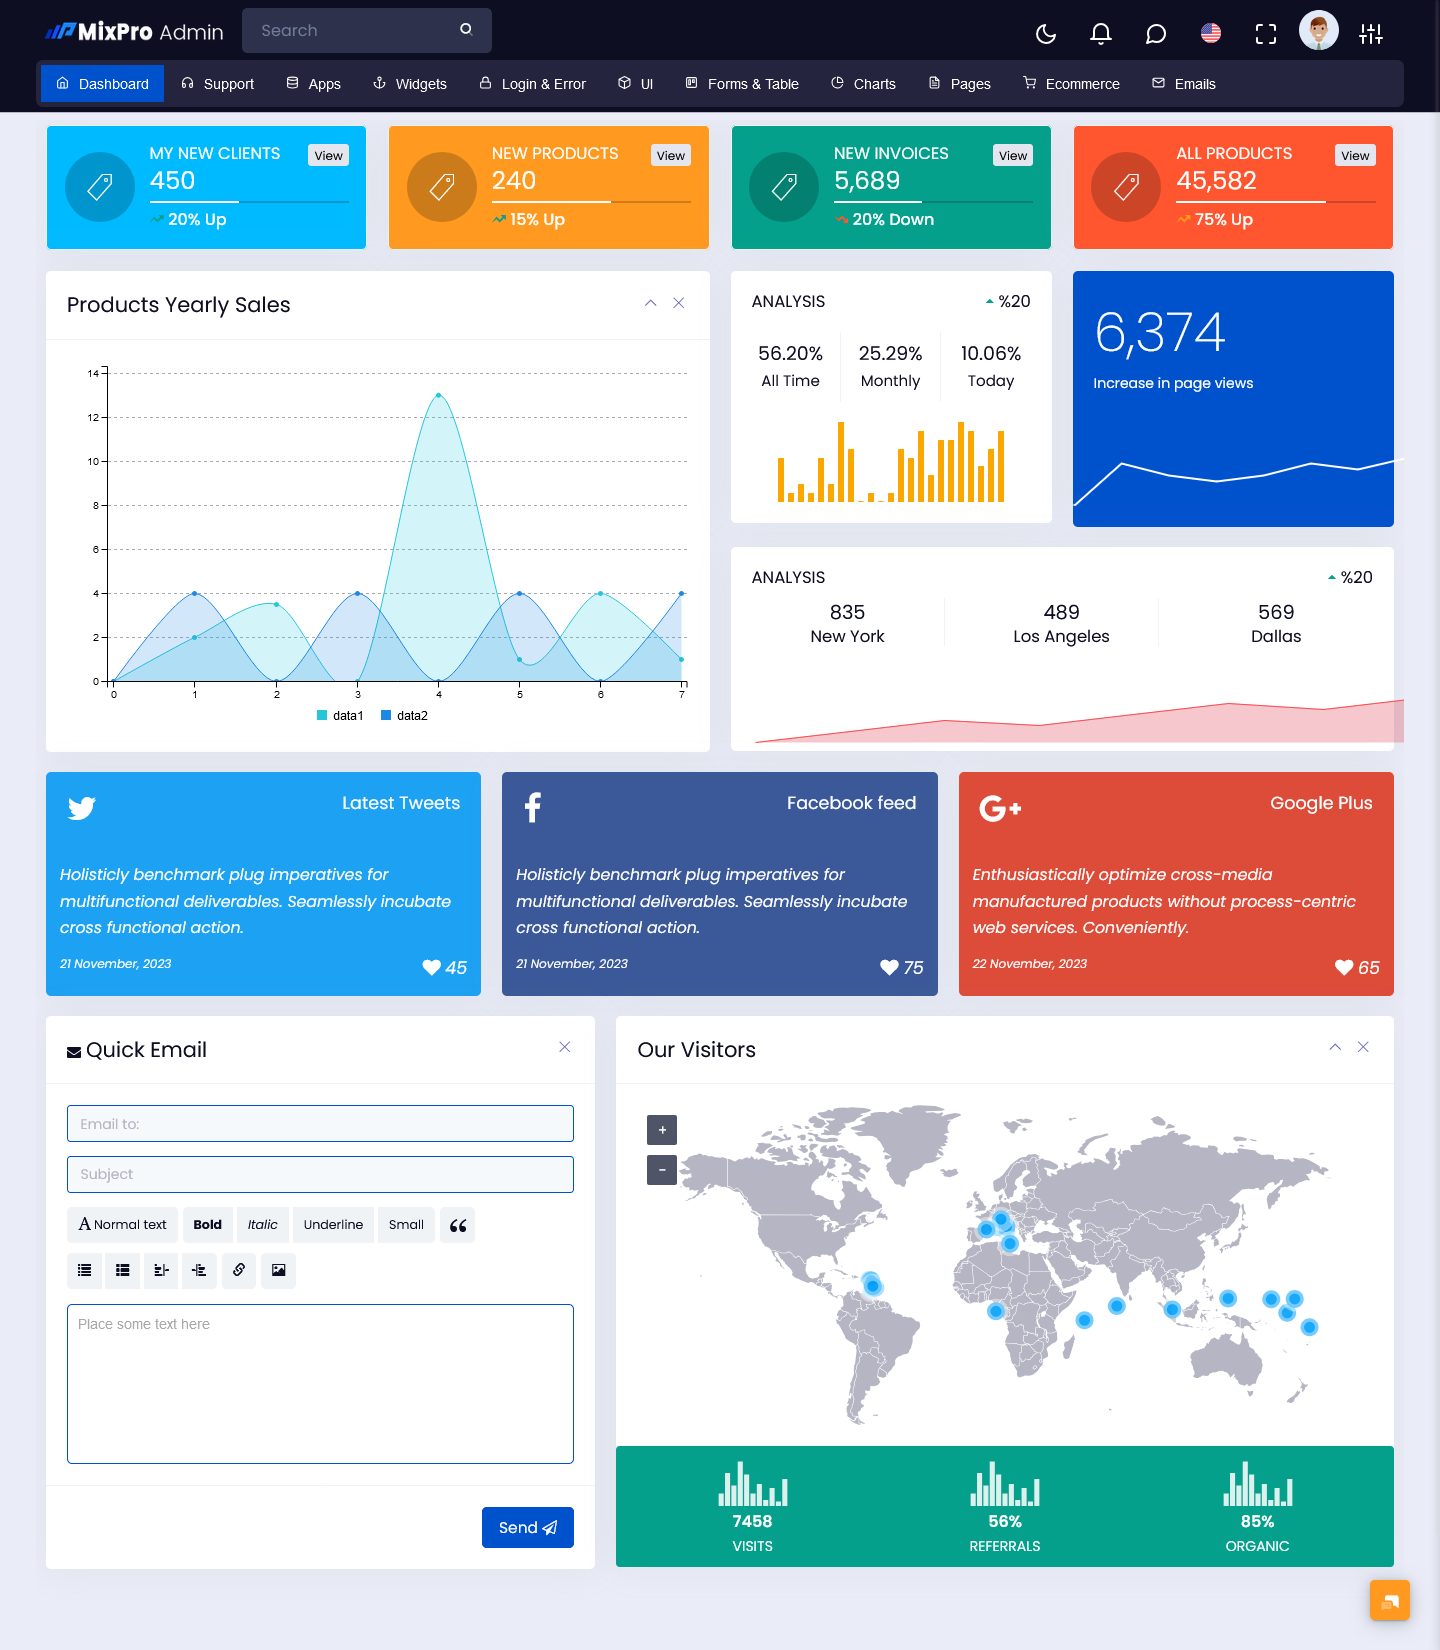
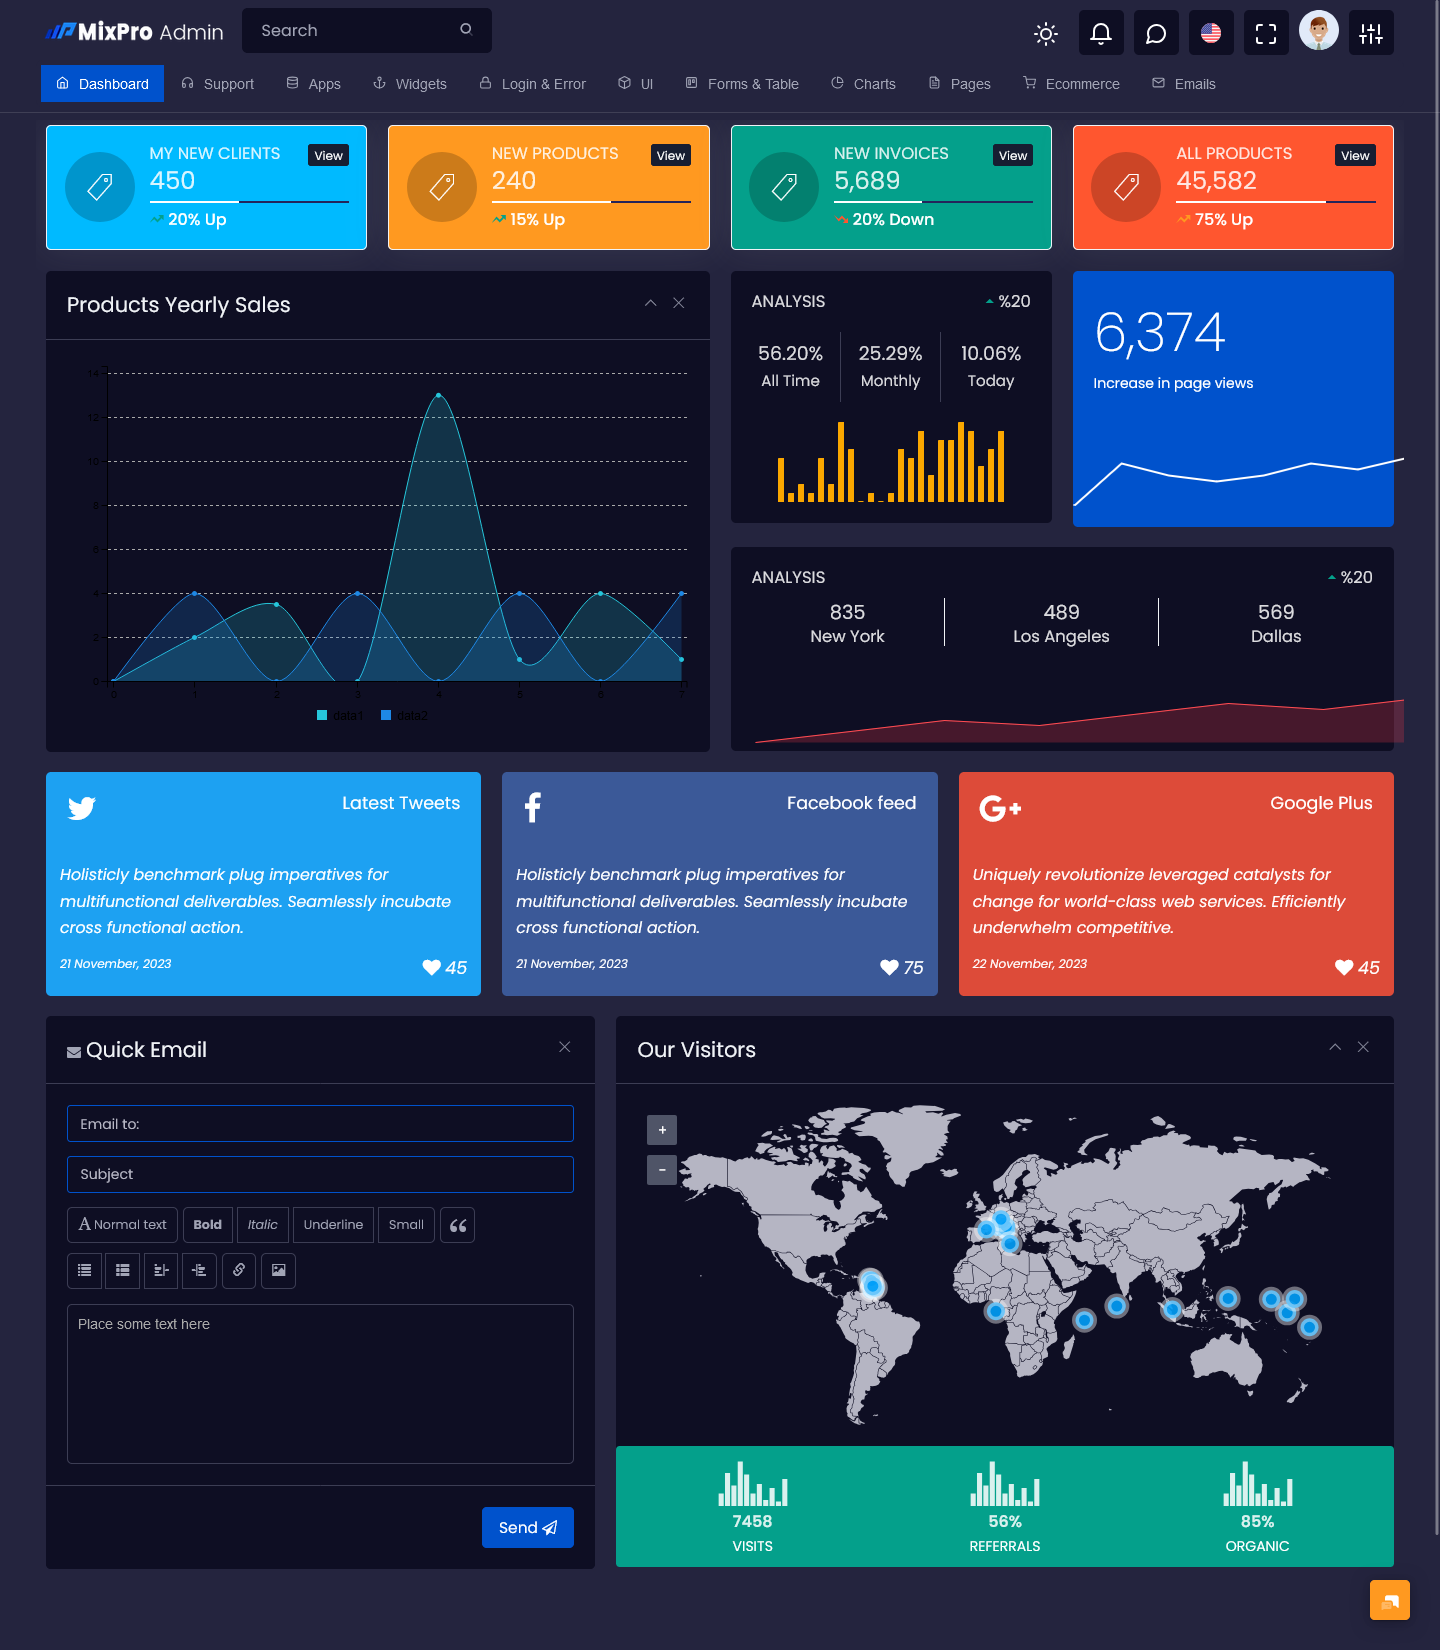
MixPro Admin
Horizontal Dashboard – Light
MORE INFO / BUY NOW DEMO
Horizontal Dashboard – Dark
MORE INFO / BUY NOW DEMO
Focus on user experience (UX).
User experience is at the forefront of dashboard design. A good dashboard should not only display data but also be easy to navigate and understand. Designers are increasingly preferring user-centered design that caters to the needs of their audience. This includes:
– Intuitive Navigation: The dashboard should have a clear and straightforward navigation system. Users should be able to find the information they need without confusion.
– Customizable Layout: Many modern dashboards allow users to customize their layout. This means users can choose which data is most important to them and organize their views accordingly.
– Accessibility: Designers are focusing on making the dashboard accessible to everyone, including persons with disabilities. These include color contrast, font size adjustment and screen reader compatibility.
Data storytelling
Data storytelling is becoming a critical element of dashboard design. Instead of just presenting numbers, designers are creating narratives that help users understand the context behind the data. This includes:
– Visualization: Effective use of charts, graphs and maps helps illustrate trends and patterns. Designers are moving beyond traditional bar and line graphs to include more engaging visuals.
– Annotations and Insights: Adding notes or insights alongside data visualizations helps users understand the significance of the information presented. For example, a sudden increase in sales may prompt users to investigate the cause.
– Interactivity: Interactive elements, such as hover effects or drill-down options, allow users to explore data in greater depth. Users can click on graphs to view more details, providing a richer experience.
Mobile-first design
As more people access data on mobile devices, a mobile-first approach to dashboard design is becoming essential. This means designing dashboards with mobile users in mind from the start. Key considerations include:
– Responsive design: Dashboards must adapt to different screen sizes, ensuring that users can access important information regardless of their device. This includes resizing elements and rearranging layouts for smaller screens.
– Touch-friendly interface: Mobile dashboards should have large buttons and touch-friendly elements to facilitate navigation on smartphones and tablets.
– Offline access: Providing offline access to dashboard data allows users to view information without an internet connection, which is especially useful for fieldwork or remote areas.
Integration of Artificial Intelligence (AI).
Artificial intelligence is transforming how we interact with data. Admin Template is increasingly incorporating AI-powered features that enhance efficiency and usability. Some of these features include:
– Predictive analytics: AI can analyze historical data to predict future trends. Dashboards that incorporate predictive analytics can help users make proactive decisions.
– Natural Language Processing (NLP): With NLP, users can ask questions in plain language and get data-driven answers. For example, a user might type, “What were our sales last quarter?” and get a visual representation of that data.
– Automated Insights: AI can provide automated insights to users, highlighting significant changes or anomalies in data. This helps users focus on the most relevant information without manually sifting through all the data.
Emphasis on data privacy and security
As data breaches become more common, dashboard design increasingly emphasizes security and privacy. These trends include:
– User authentication: Dashboards are implementing stronger authentication methods, such as two-factor authentication, to protect sensitive data.
– Data Encryption: Encrypting data both in transit and at rest ensures that sensitive information remains secure. The dashboard design incorporates these features to assure users about their data privacy.
– Role-based access: Many dashboards now have role-based access controls, allowing users to view only data relevant to their roles. This reduces the risk of unauthorized access to sensitive information.
Minimal and clean design
Simplicity is key in modern dashboard design. A cluttered interface can overwhelm users and obscure important information. Emerging trends focus on:
– Minimal aesthetics: Dashboards adopt clean lines, ample white space and a limited color palette to create a more streamlined look. This helps to focus on the most important data.
– Consistent design elements: Using consistent fonts, colors and icons across the dashboard ensures a cohesive user experience. This helps users navigate the dashboard more easily.
– Focus on essential metrics: Designers are prioritizing essential metrics over unnecessary data. This means displaying only the most relevant information, allowing users to focus on what matters.
Real-time data updates
In today’s fast-paced business environment, having access to real-time data is critical. Dashboards are increasingly incorporating features that allow for real-time data updates. This includes:
– Live data feeds: Integrating live data feeds ensures that users always see the most current information. This is especially important for industries like finance, where data changes rapidly.
– Automatic refresh: Dashboards are implementing automatic refresh options that update data at set intervals, keeping users informed without manual intervention.
Enhanced collaboration features
As remote work becomes more common, dashboards are focusing on collaboration features that allow teams to work together effectively. These trends include:
– Shared dashboards: Many templates now allow users to share dashboards with team members, promoting collaboration and transparency.
– Comment and Annotations: Users can leave comments or annotations on specific data points, facilitating discussions around the data.
– Integration with communication tools: Dashboards are integrating with popular communication tools, such as Slack or Microsoft Teams, allowing users to receive updates and notifications directly in the platform of their choice.
conclusion
The world of Dashboard Template design is rapidly evolving, driven by advances in technology and changing user needs. With a focus on user experience, data storytelling, mobile-first design, AI integration and enhanced security, designers are creating dashboards that are not only functional but also intuitive and attractive.
As you explore dashboard templates for your projects, keep these emerging trends in mind. Adopting these innovations will help you create a powerful tool for data visualization and decision-making, which will ultimately lead to success for your business or organization. Whether you’re a developer, designer, or business leader, staying ahead of these trends will ensure you’re equipped to meet the demands of the future.

