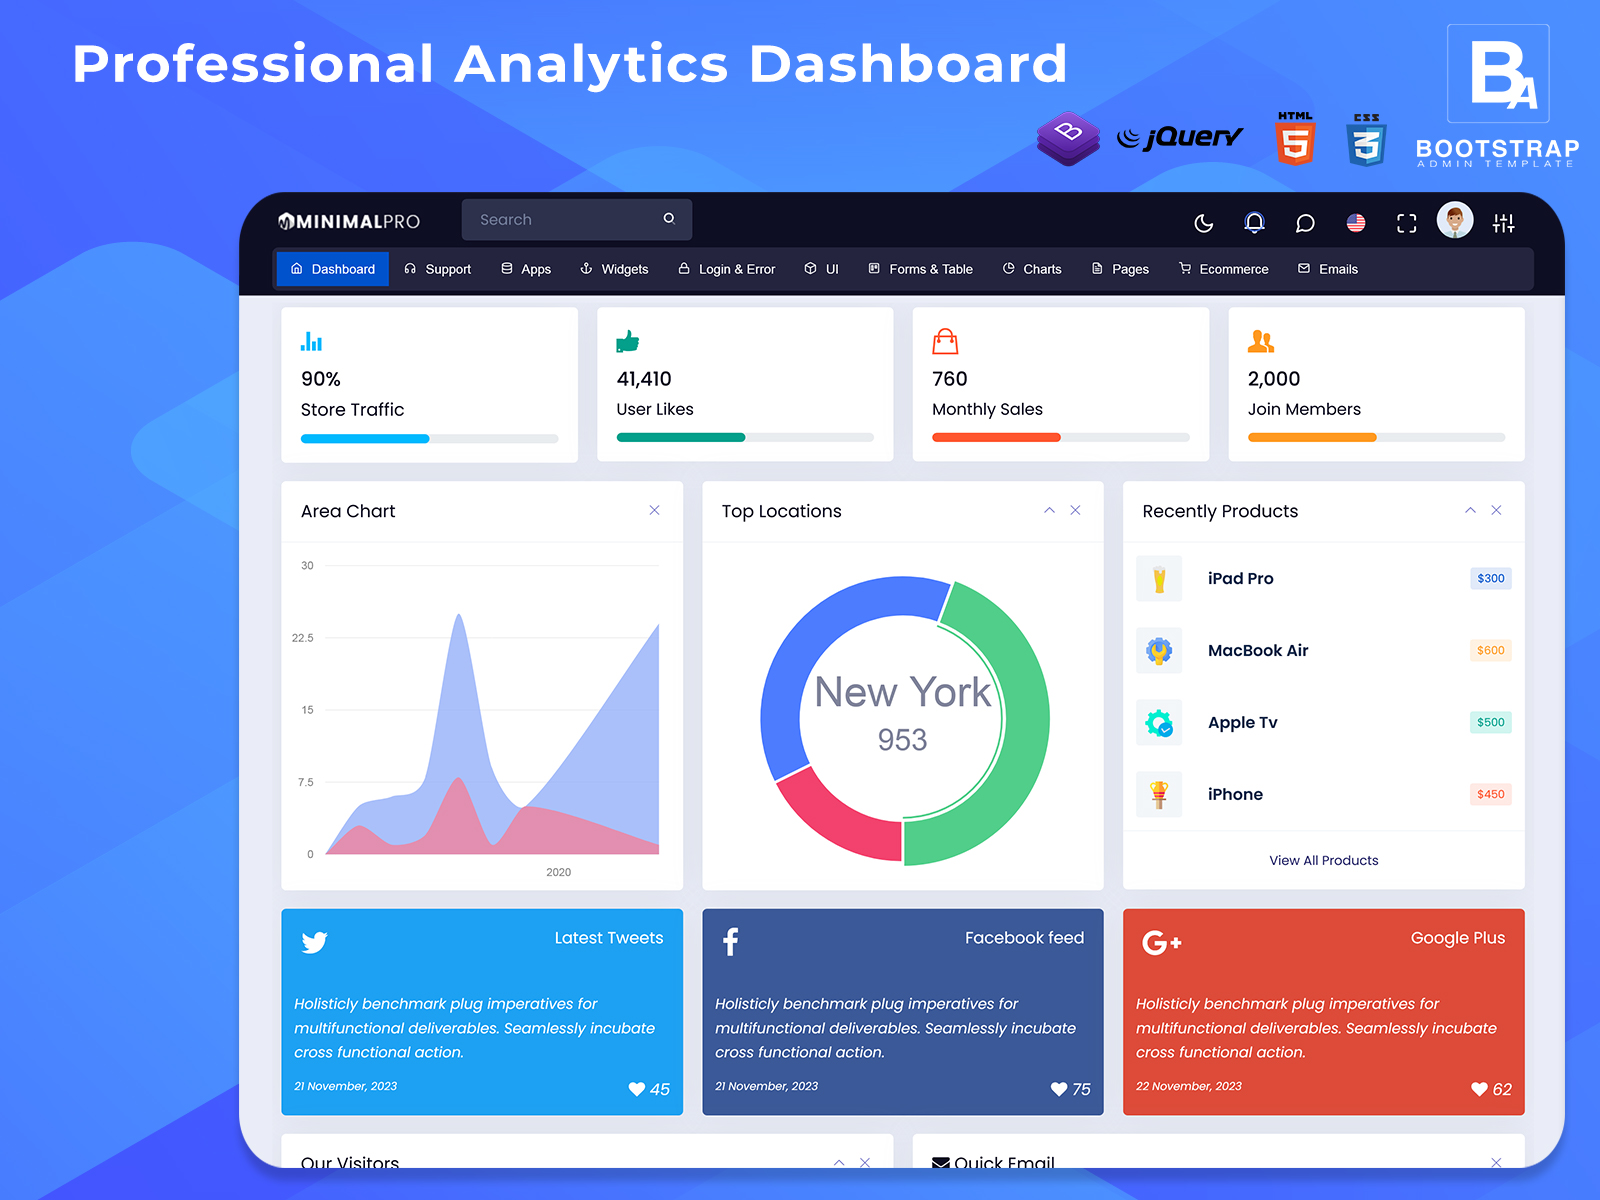
Analytical Dashboard – Visualize and Track Business KPIs in 2025
An Analytical Dashboard is one of the most important tools for any business that wants to grow and stay organized. When you have so much data to look at — like sales numbers, orders, revenue, and customer trends — it can get confusing to make sense of it all. That’s exactly where an Analytical Dashboard comes in.
A good dashboard does more than just show numbers. It helps you see the full picture behind your data. You can track how your business is performing, which products are selling the most, how your teams are working, and what needs improvement. Whether you run a small online store, a growing startup, or a large company, an Analytical Dashboard gives you one place to see what’s happening.
With this, you don’t have to jump from one tool to another. Everything sits in one easy-to-read interface. You can make better decisions, respond faster to changes, and find opportunities to grow. The best part is that it saves time. Instead of making spreadsheets every day, you have real-time information ready whenever you need it.
This kind of dashboard is also helpful for teams. Sales teams can check how close they are to targets. Managers can see which areas need more focus. And executives can get reports without waiting days for someone to compile the numbers. This means everyone is on the same page and works towards the same goals.
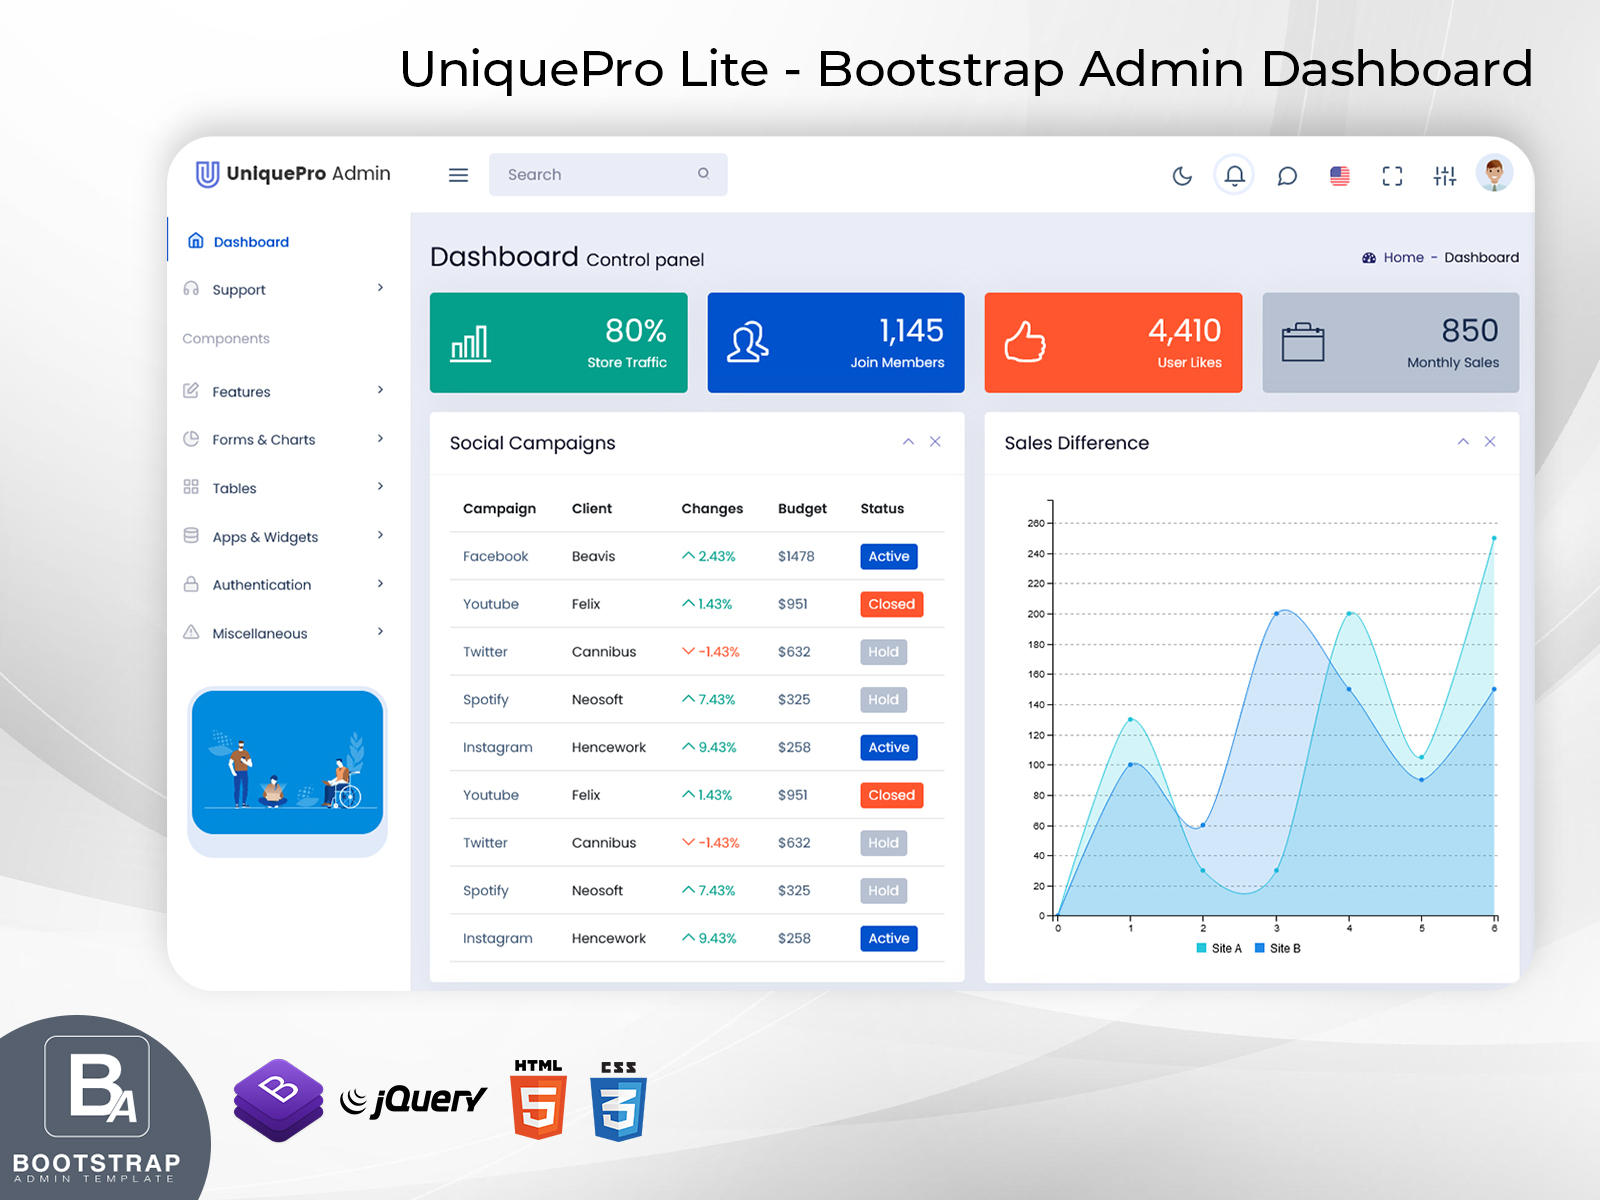
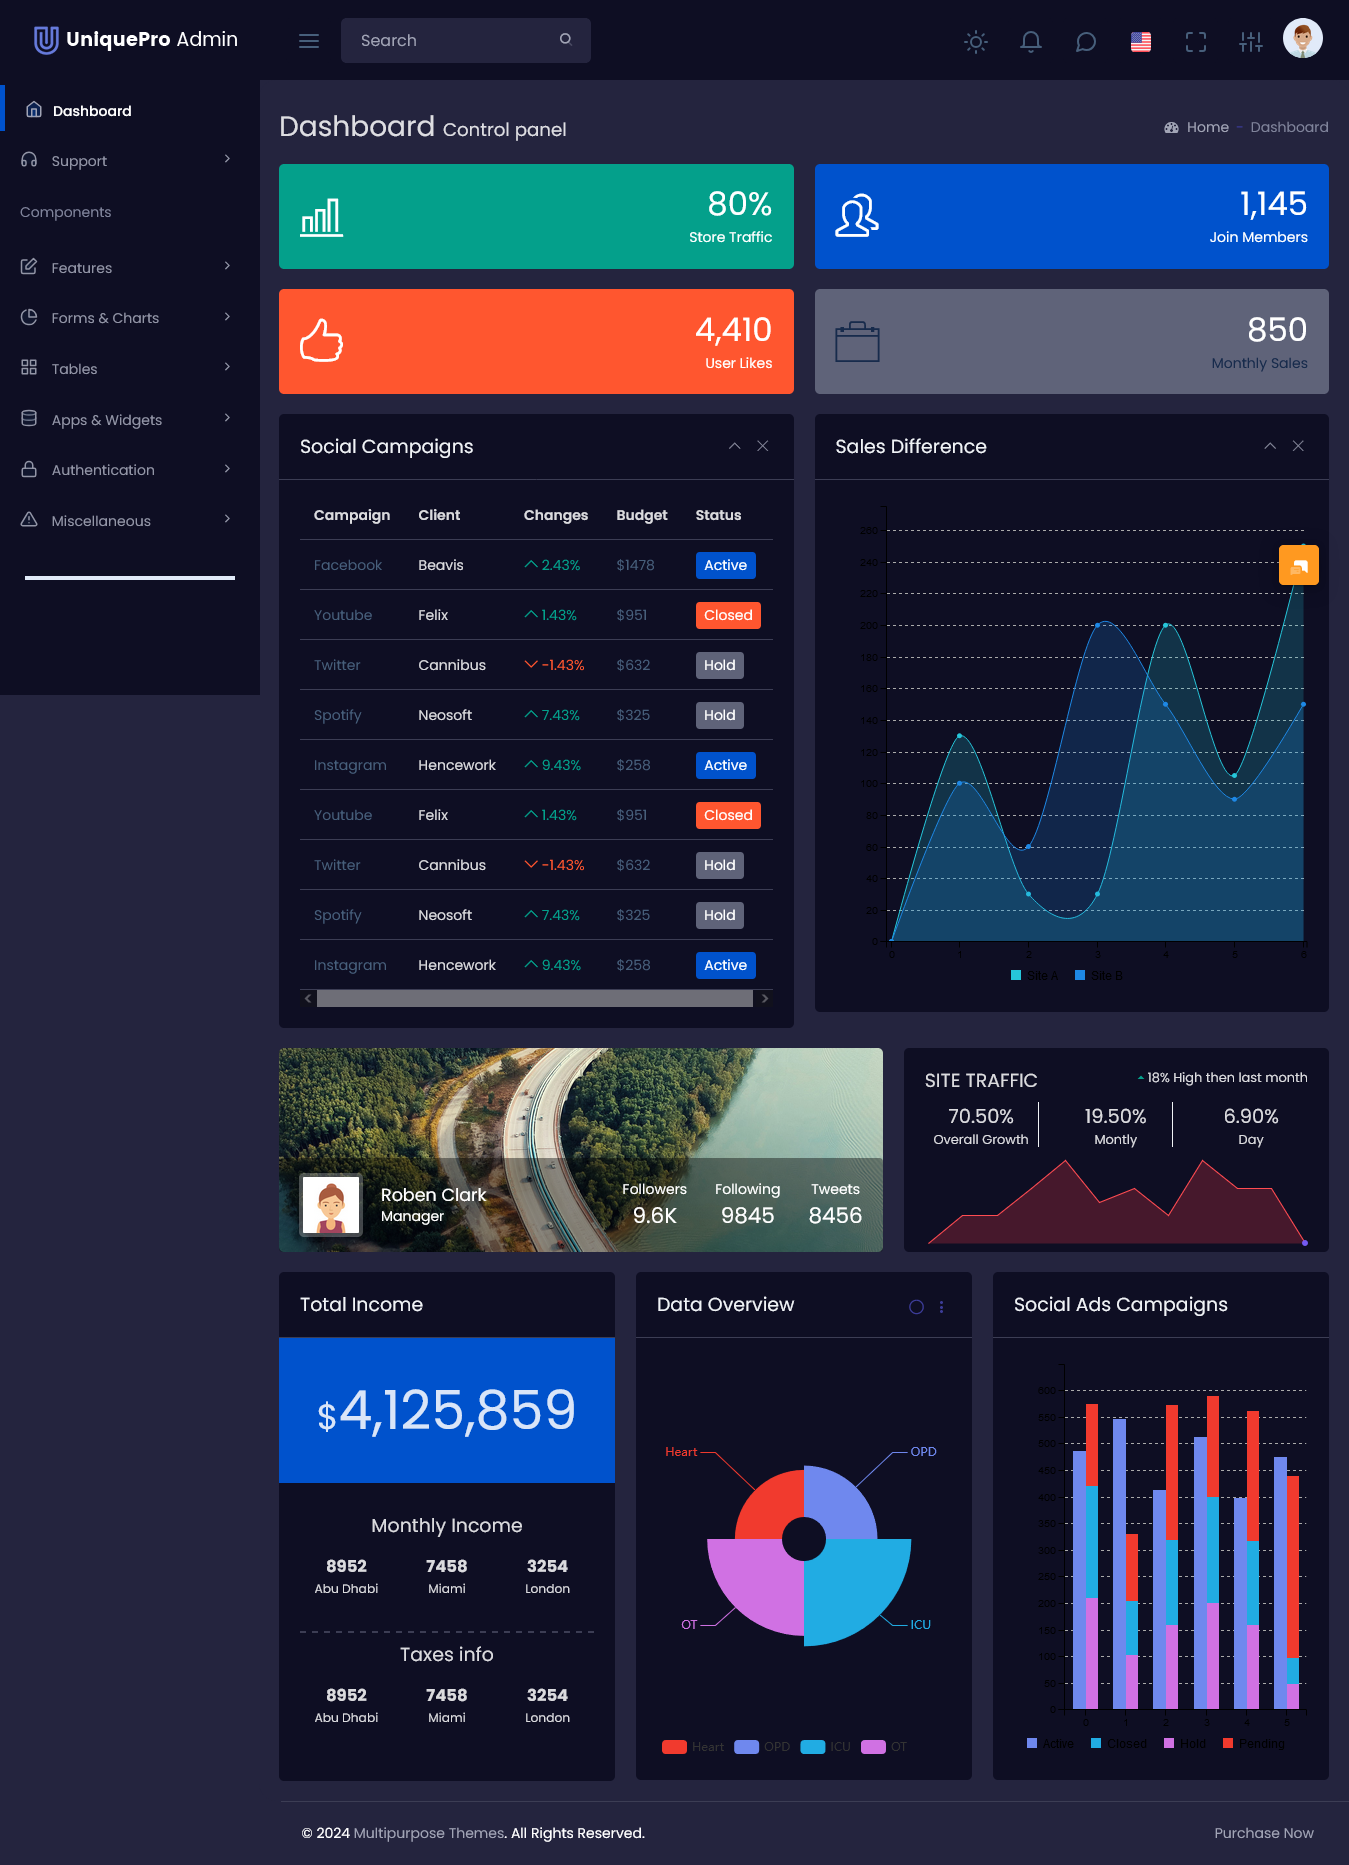
Explore Dashboards Layout of Unique Pro Admin
Light Dashboard
BUY NOW DEMO
Dark Dashboard
BUY NOW DEMO
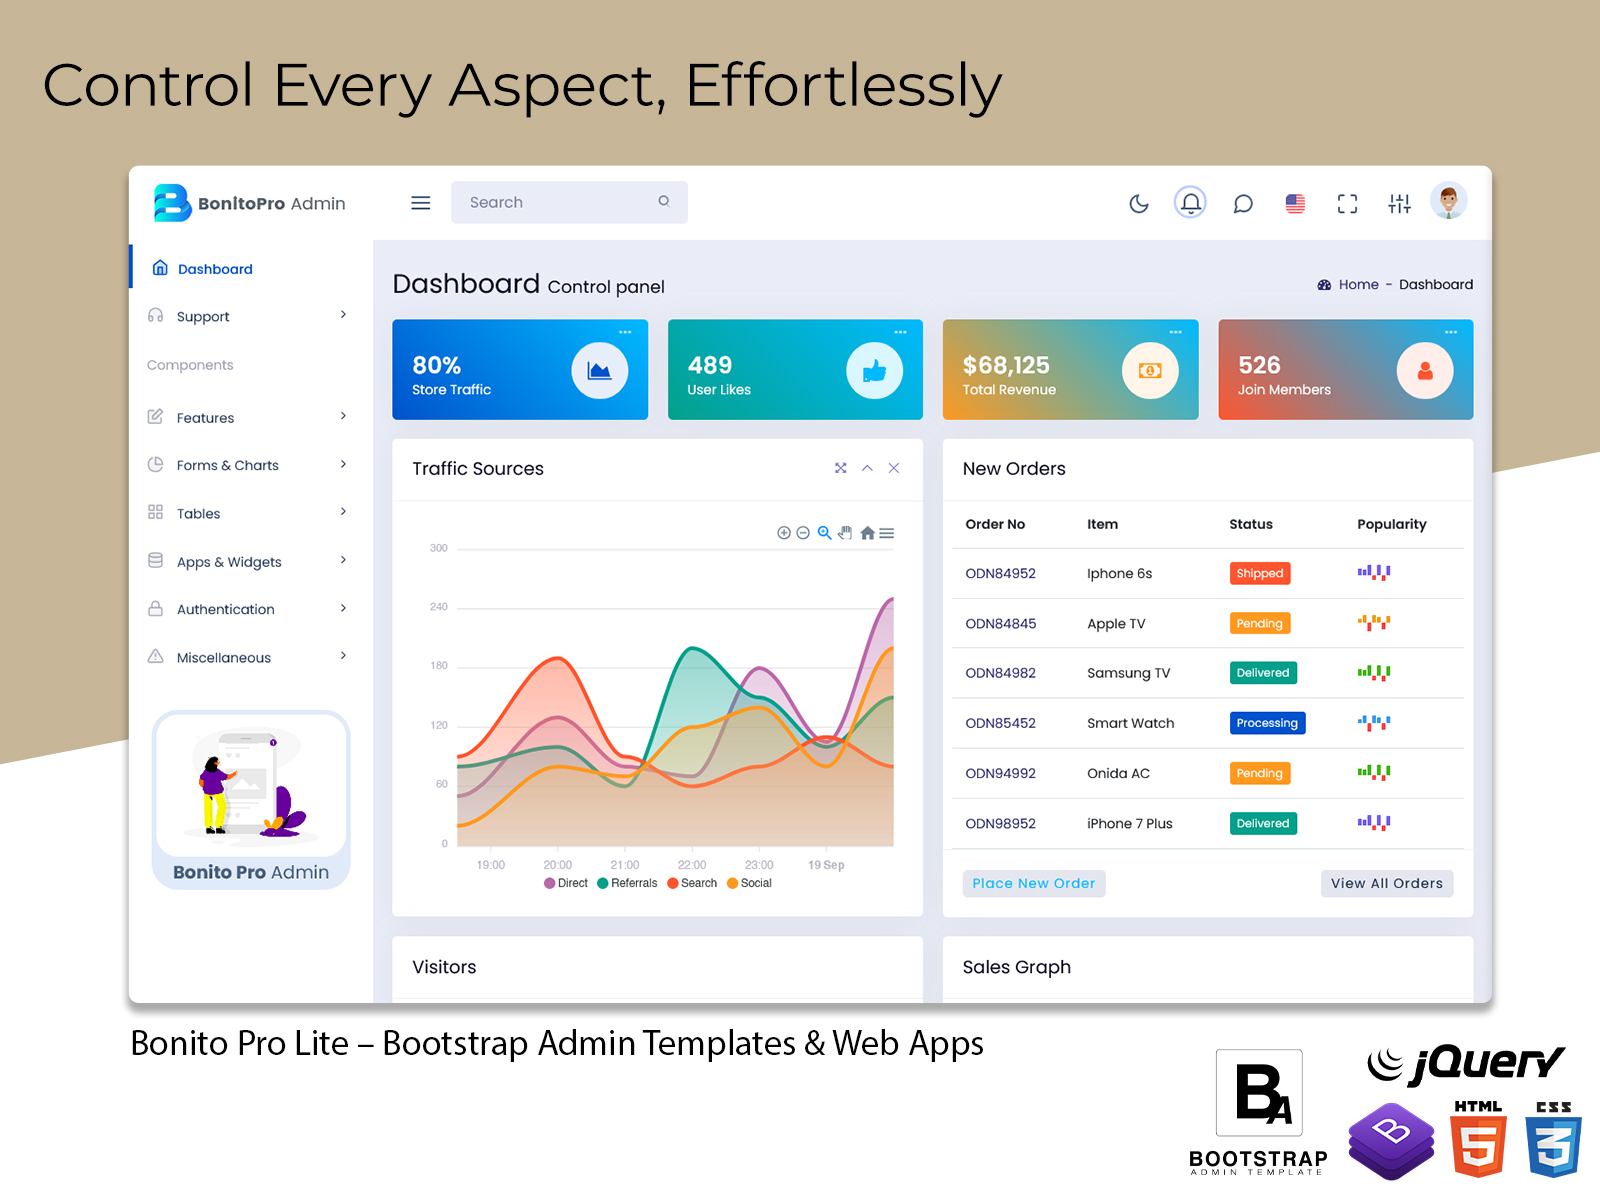
Why Bootstrap Admin Dashboard is Ideal for Modern Businesses
Building a dashboard from scratch can take a lot of time and resources. That’s why using a Bootstrap Admin Dashboard is the smart choice for developers and companies today. Bootstrap is one of the most popular frameworks for building responsive and mobile-friendly websites.
A Bootstrap Admin Dashboard uses clean, organized code and comes with reusable components. This means you don’t have to worry about whether the dashboard will work on different screen sizes — it will automatically adjust for desktops, tablets, and phones.
One of the main benefits of using a Bootstrap Admin Dashboard is that it helps developers work faster. They don’t need to design every button, table, or chart from zero. The ready-made layouts, widgets, and design elements allow teams to focus on the features that matter most.
Another big advantage is that it’s easy to customize. If your business needs special Analytical Charts, sales reports, or user management sections, you can add or remove sections without any trouble. This makes the Bootstrap Admin Dashboard a flexible option that works for many industries — from online stores to finance, education, healthcare, and more.
When you combine the power of Bootstrap with an Analytical Dashboard, you get a smooth and modern admin experience that’s both user-friendly and efficient.
Using CRM Software Dashboard to Manage Customers and Sales
If your business deals with customers, you probably know how important it is to keep track of interactions, leads, deals, and support tickets. This is where a CRM Software Dashboard becomes essential. CRM stands for Customer Relationship Management. It helps you store and manage customer information in one place.
A CRM Software Dashboard shows you how your sales pipeline is performing. You can see which leads are moving forward, which deals are about to close, and where you may be losing opportunities. Sales teams love CRM Dashboards because they can easily follow up on tasks, schedule calls, and know exactly which clients to prioritize.
A good CRM Software Dashboard doesn’t just help sales teams. It can also show insights for marketing teams, customer support agents, and managers. For example, marketing teams can see which campaigns are working best. Support teams can check customer satisfaction scores and respond to tickets faster. And managers can get an overview of all activities to make better business decisions.
When you use a Bootstrap Admin Dashboard that includes CRM Dashboards, you get a simple, organized system for handling customer relationships. Everything stays updated in real-time, so you don’t have to wait for weekly reports. You can fix problems quickly and make customers happier.
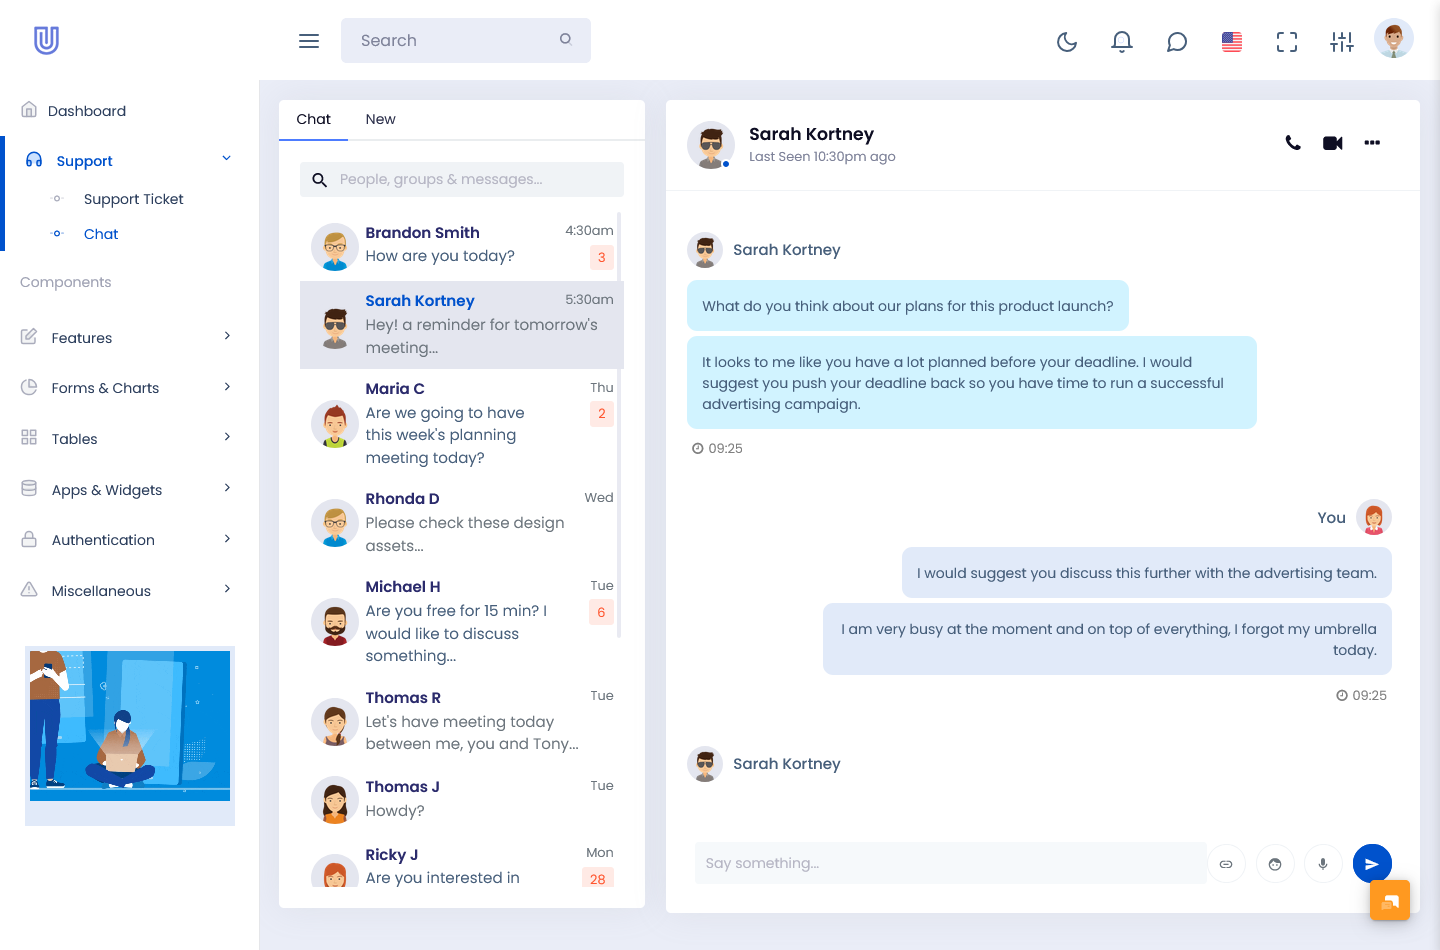
Support Chat Page
BUY NOW DEMO
How CRM Dashboards Improve Team Collaboration
CRM Dashboards do more than just show data. They help teams work together better. With clear Analytical Charts, every team member knows what’s going on. Sales agents can see which clients need follow-ups. Marketing teams can check which ads or emails brought in the most leads. Managers can easily spot where sales are dropping or where extra effort is needed.
This kind of transparency removes guesswork. It stops teams from working in silos because everyone has access to the same information. Good CRM Dashboards also make it easy to share updates. For example, when a deal is closed, the finance team can be alerted automatically. When a client raises a support ticket, the service team can handle it right away.
Another benefit is that CRM Dashboards are easy to access. Since they work on a Bootstrap Admin Dashboard, they can be opened on laptops, tablets, or even smartphones. This means salespeople on the go can check customer details anytime, anywhere.
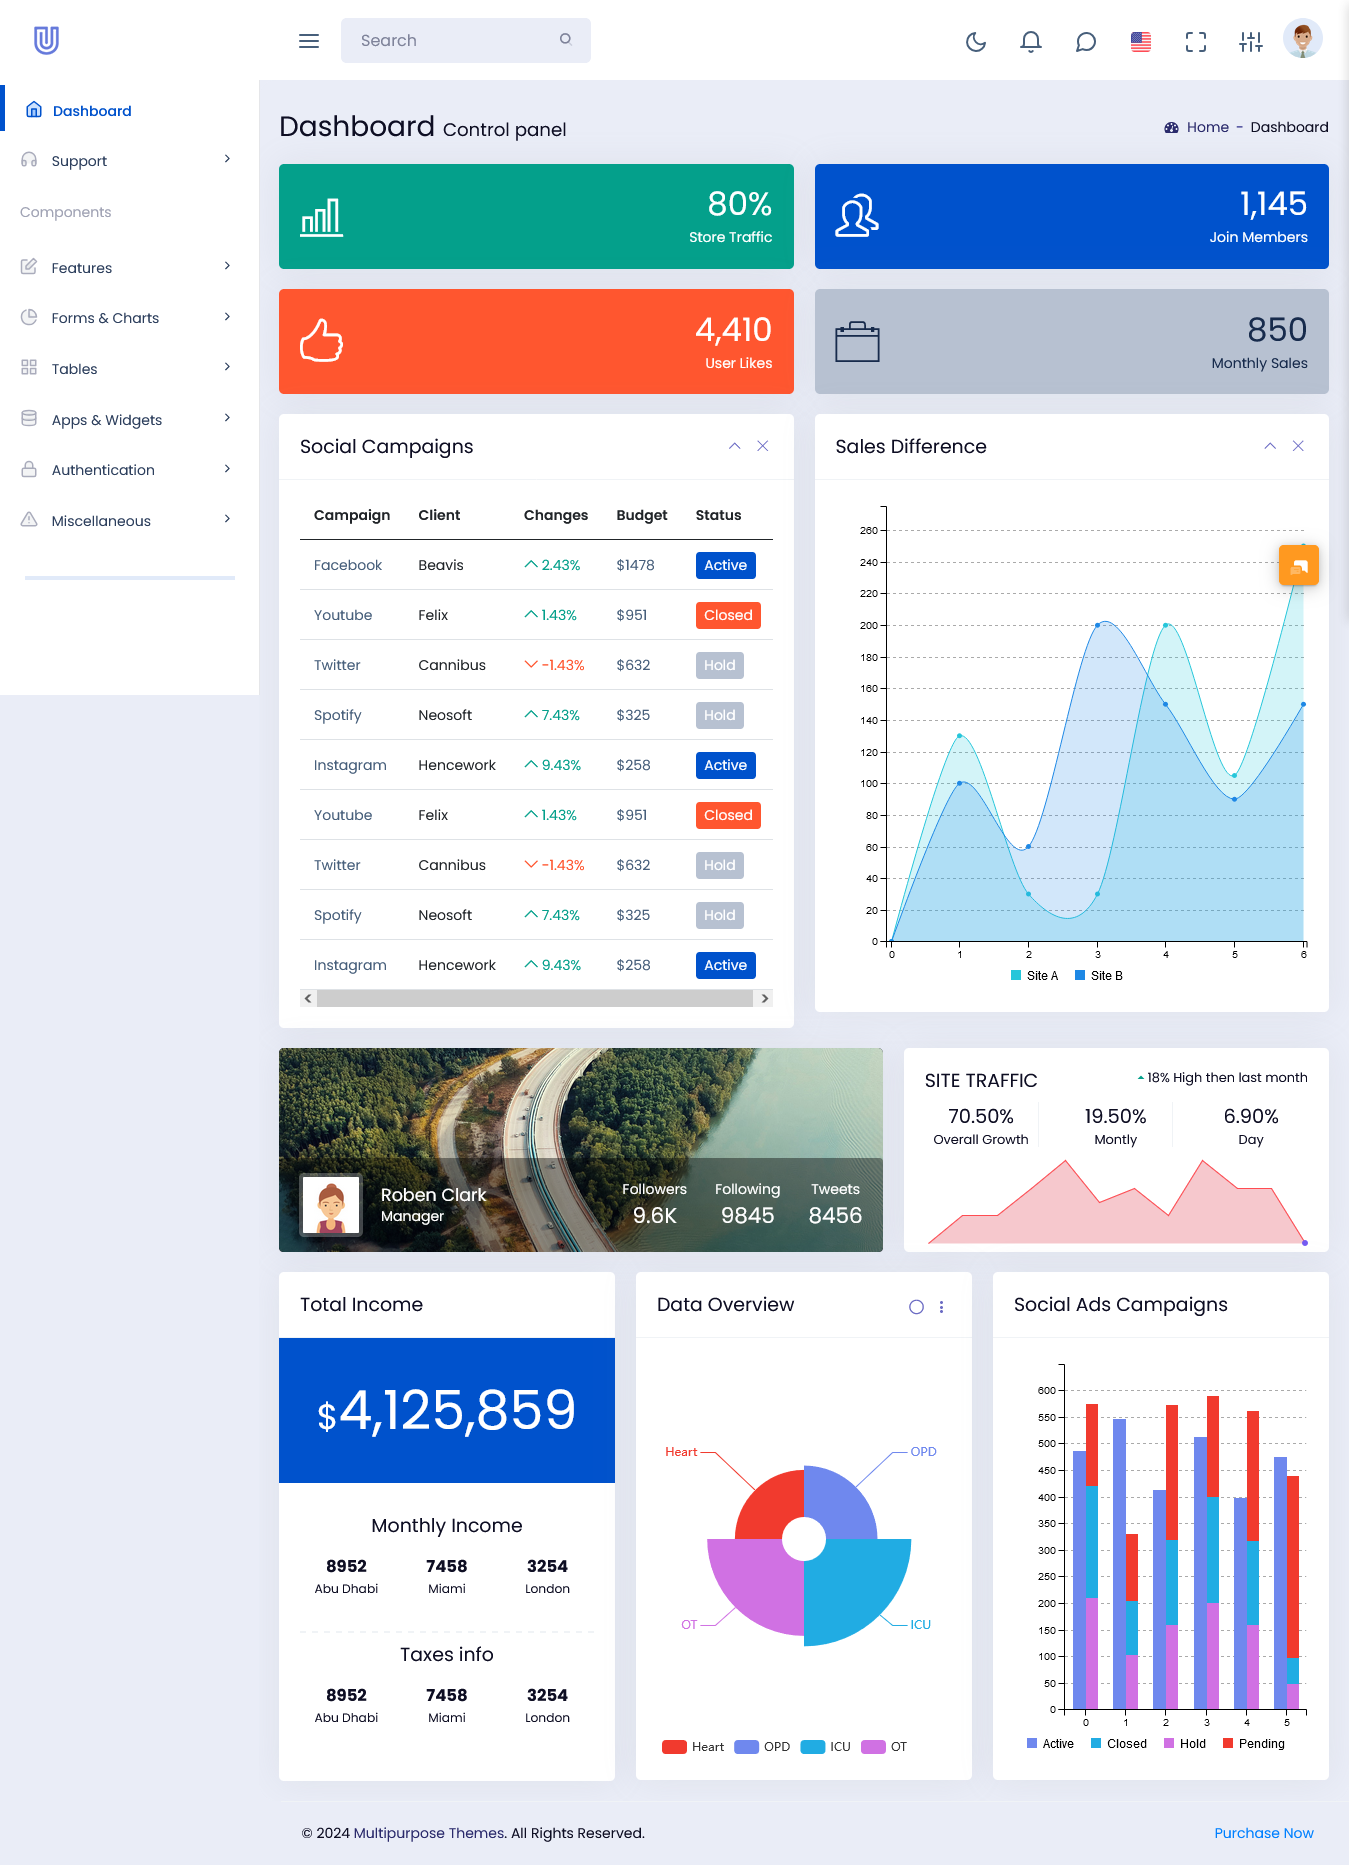
Why Analytical Charts Matter in a Dashboard
Analytical Charts are at the heart of any good Analytical Dashboard. Seeing rows of numbers can get tiring and confusing. But when you turn data into clear charts and graphs, it becomes easier to spot patterns and trends.
Analytical Charts can be used to compare sales across different months, track user sign-ups, see which products are most popular, or analyze customer behavior. Pie charts, bar charts, line graphs — all of these make data understandable at a glance.
With well-designed Analytical Charts, you can notice problems before they get too big. For example, if a product’s sales are dropping for three months in a row, you’ll see it immediately on your dashboard. You can then take action — maybe launch a promotion, improve the product, or run a new marketing campaign.
When Analytical Charts are part of a Bootstrap Admin Dashboard, you know they will look good on any device. This means your managers, team members, or clients can check the same reports without any technical issues.
Good charts are also interactive. You can click on parts of a chart to get more details, filter data, or compare time periods. This turns your Analytical Dashboard into a powerful tool for decision-making.
Importance of a Well-Organized Dashboard Layout
A beautiful dashboard means nothing if it’s hard to use. That’s why having a clear and thoughtful Dashboard Layout is so important. The best dashboards are designed so that the most important information appears right at the top. This saves time and helps users focus on what matters first.
A good Dashboard Layout groups similar information together. For example, sales data sits next to revenue charts. Customer information is near CRM Dashboards. Recent orders, top-selling products, and new leads are easy to find.
This smart arrangement reduces clutter and helps users navigate quickly. When your team doesn’t have to search for what they need, they can do their jobs faster and more accurately.
Another part of a strong Dashboard Layout is customization. Not every business needs the same widgets. With a flexible Bootstrap Admin Dashboard, you can add or remove sections as your needs change. For example, you can hide a chart if it’s not useful or bring in new data sources when your business grows.
A clean Dashboard Layout is also important for people who are not tech-savvy. Even if someone has never used an admin panel before, they should be able to log in, find the Analytical Charts, check the CRM Dashboards, and understand what’s happening in the business.
Combining CRM Dashboards with Analytical Dashboard for Complete Insights
When you bring together an Analytical Dashboard and CRM Dashboards in one place, you get the best of both worlds. The Analytical Dashboard shows you the big picture — how your business is doing overall. The CRM Dashboards dive deeper into customer interactions, sales pipelines, and deals.
This combination makes it easier to connect your data. You can see how a new marketing campaign affects sales numbers. You can check if faster customer support leads to repeat purchases. You can analyze which sales agents bring in the most revenue.
When all this information is available in one Bootstrap Admin Dashboard, your team doesn’t waste time juggling between multiple tools. Everything they need is under one roof, with an easy-to-use Dashboard Layout and clear Analytical Charts.
Future-Proofing Your Business with an Analytical Dashboard
In today’s fast-paced market, having an Analytical Dashboard is no longer a luxury — it’s a necessity. Without real-time insights, businesses risk missing out on opportunities or reacting too slowly to problems.
A good dashboard grows with your business. As you add new products, services, or teams, you can add new sections to your Bootstrap Admin Dashboard. You can build new CRM Dashboards for different departments. You can add extra Analytical Charts for more detailed reports.
This flexibility makes your dashboard a long-term investment. It keeps your team focused, informed, and ready to act on data. You don’t have to spend extra money on expensive software every time you scale up. Instead, your dashboard evolves with you.
How an Analytical Dashboard Builds Trust with Clients and Teams
When you share insights from your Analytical Dashboard, you build trust with your clients and team members. Clients appreciate clear updates about progress, performance, and results. They can see that you use real data to make decisions.
For your internal teams, the dashboard becomes a single source of truth. There’s no confusion about what’s happening. Everyone works with the same numbers and goals. This transparency keeps everyone motivated and accountable.
CRM Dashboards add to this trust by keeping customer information safe and organized. Teams can respond faster to requests, resolve complaints quickly, and deliver a better experience.
Making the Most of Your Dashboard Layout
To get the best results, it’s important to design your Dashboard Layout carefully. Don’t overload your users with too much information at once. Focus on the KPIs that matter most. Keep charts simple and clear. Group information logically.
Check your Dashboard Layout regularly. As your business changes, your dashboard should change too. Remove widgets you don’t use. Add new Analytical Charts when you launch a new product or campaign. Ask your team what information they find useful and adjust the layout to match.
A Bootstrap Admin Dashboard makes this process easy because it’s built for customization. You can test new layouts, rearrange widgets, or update your CRM Dashboards without rebuilding your entire system.
Final Thoughts
An Analytical Dashboard is more than just a collection of numbers. It’s a tool that helps you run your business smarter, track your progress, and make confident decisions. When you build it on a Bootstrap Admin Dashboard, you get speed, flexibility, and a clean design that works on any device.
Adding CRM Dashboards and clear Analytical Charts turns your dashboard into a complete business command center. With a thoughtful Dashboard Layout, you keep things simple, organized, and easy to use for everyone.
No matter what industry you’re in, an Analytical Dashboard can give you the insights you need to grow. Take control of your data, stay ahead of the competition, and make every decision count — one chart, one report, one dashboard at a time.