Analytical Dashboard Built on Bootstrap 5 – The Ultimate Dashboard Layout
Today, understanding your data can make the difference between a good decision and a great one. Businesses, developers, and teams need clear visuals to handle daily tasks and long-term goals. That’s why having an Analytical Dashboard is so important. Our Bootstrap admin template gives you a simple, powerful, and visually rich dashboard made especially for data and analytics.
Buy Now
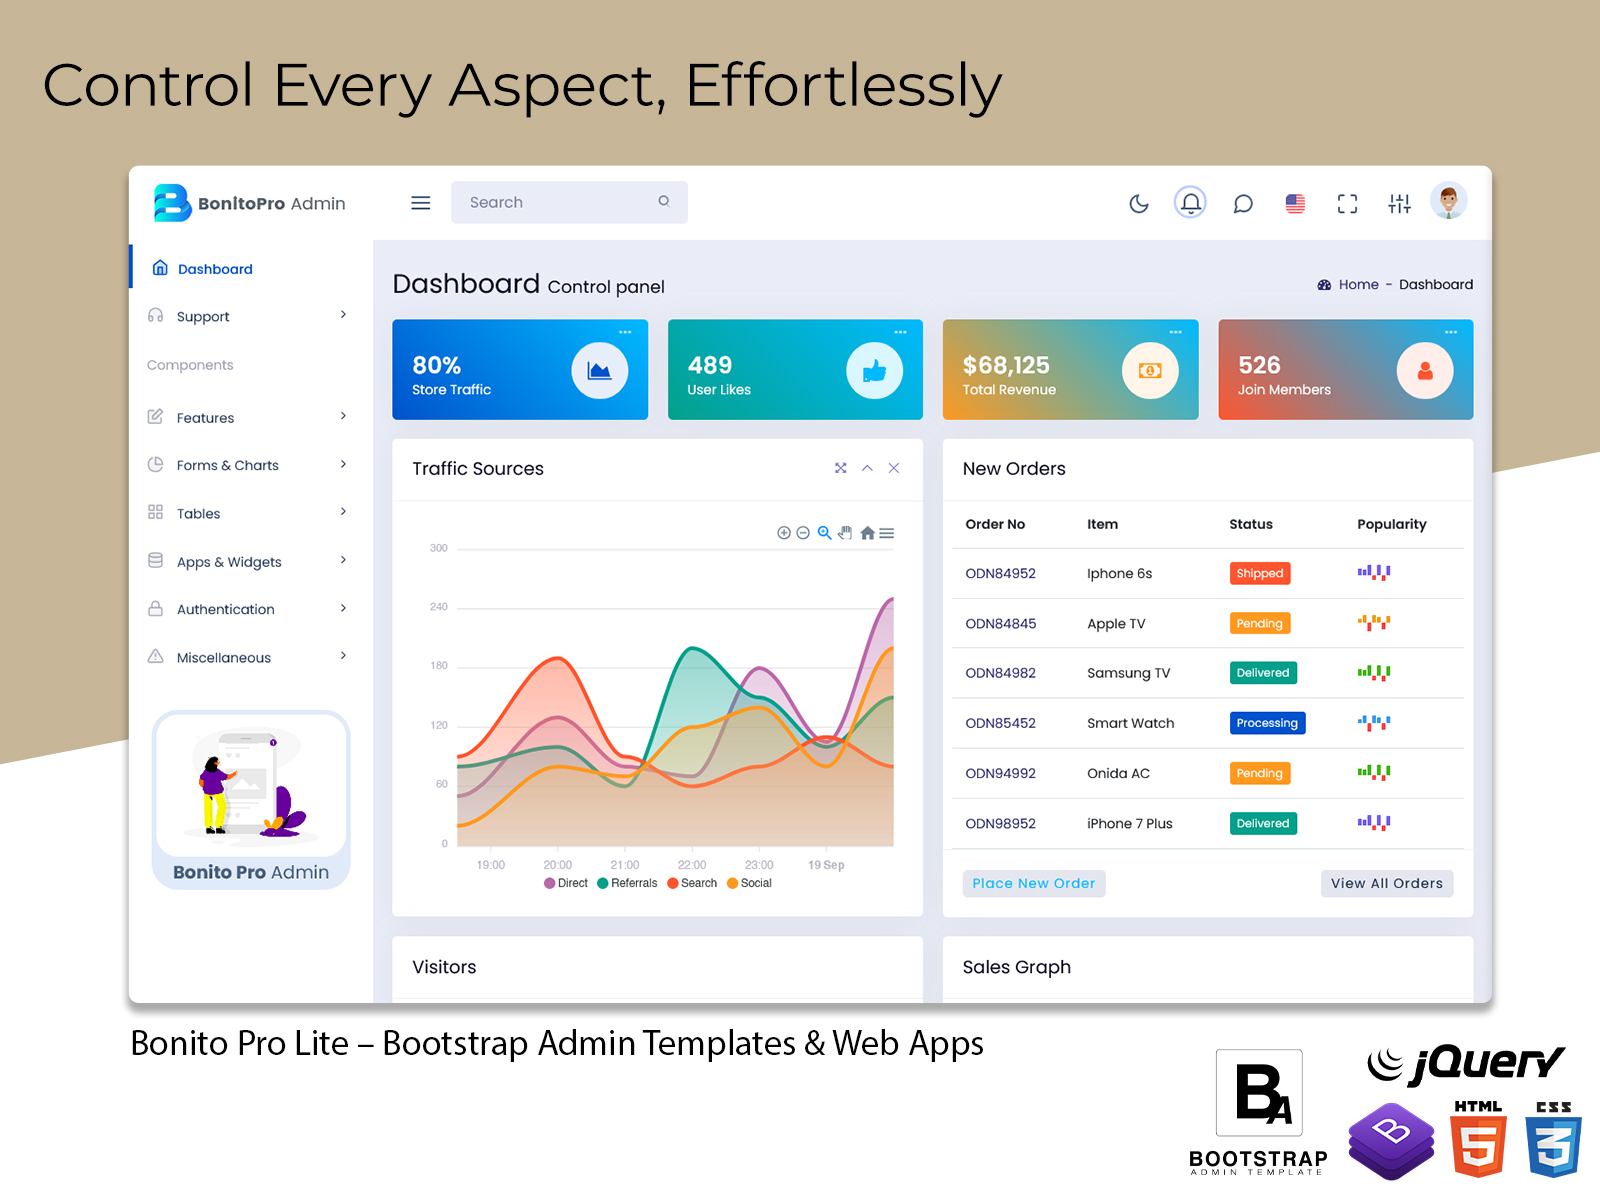
When you first open our Analytical Dashboard, you’re greeted with a stunning and structured dashboard layout that organizes complex data into digestible insights. Built using Bootstrap 5 and modern UI practices, the interface feels both clean and robust, letting users focus on what matters most: the data. Whether you’re tracking website performance, business KPIs, or customer engagement, our dashboard transforms numbers into powerful visual stories.
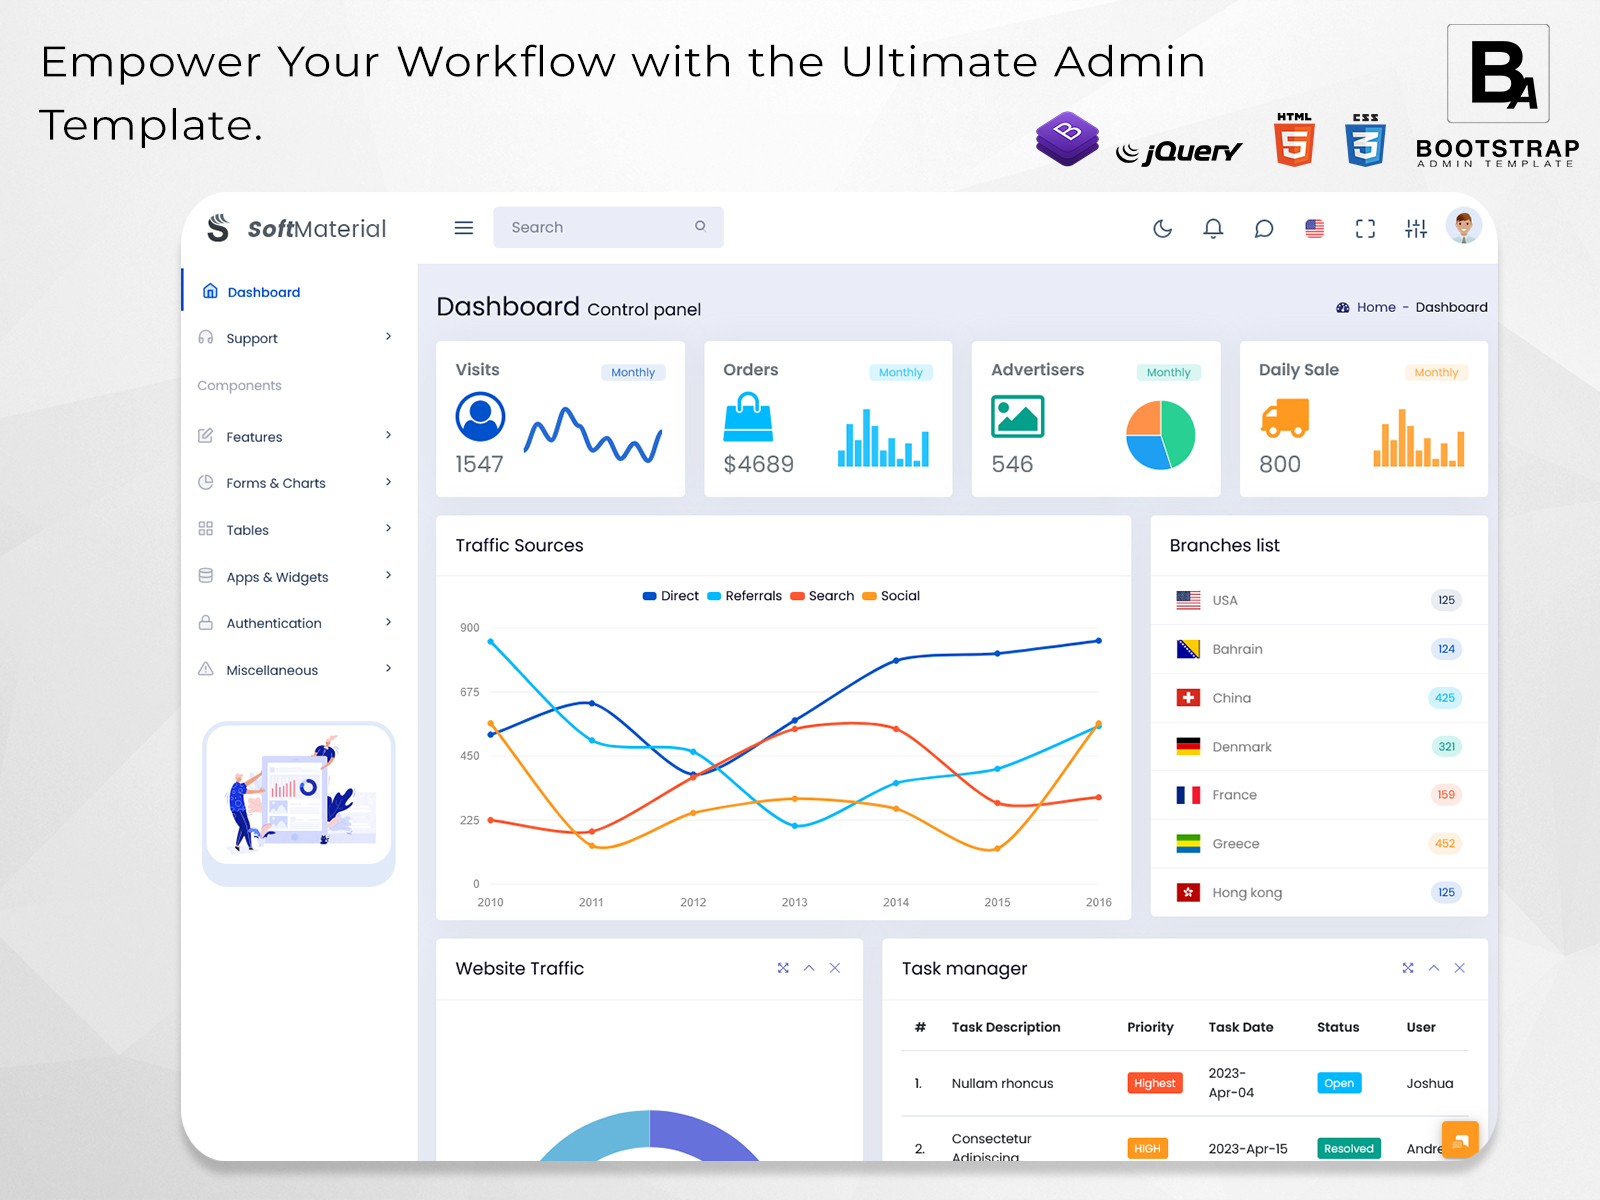
What sets this Bootstrap Admin Dashboard apart is its deep emphasis on clarity and function. The control panel is intelligently arranged, displaying real-time metrics for visits, orders, advertisers, and daily sales. Each of these elements is crucial for any analytics project, and we’ve ensured that they appear in a format that’s easy to interpret at a glance. By putting vital statistics front and center, the Analytical Dashboard empowers users to make informed decisions quickly, without the need to dig through complex datasets.
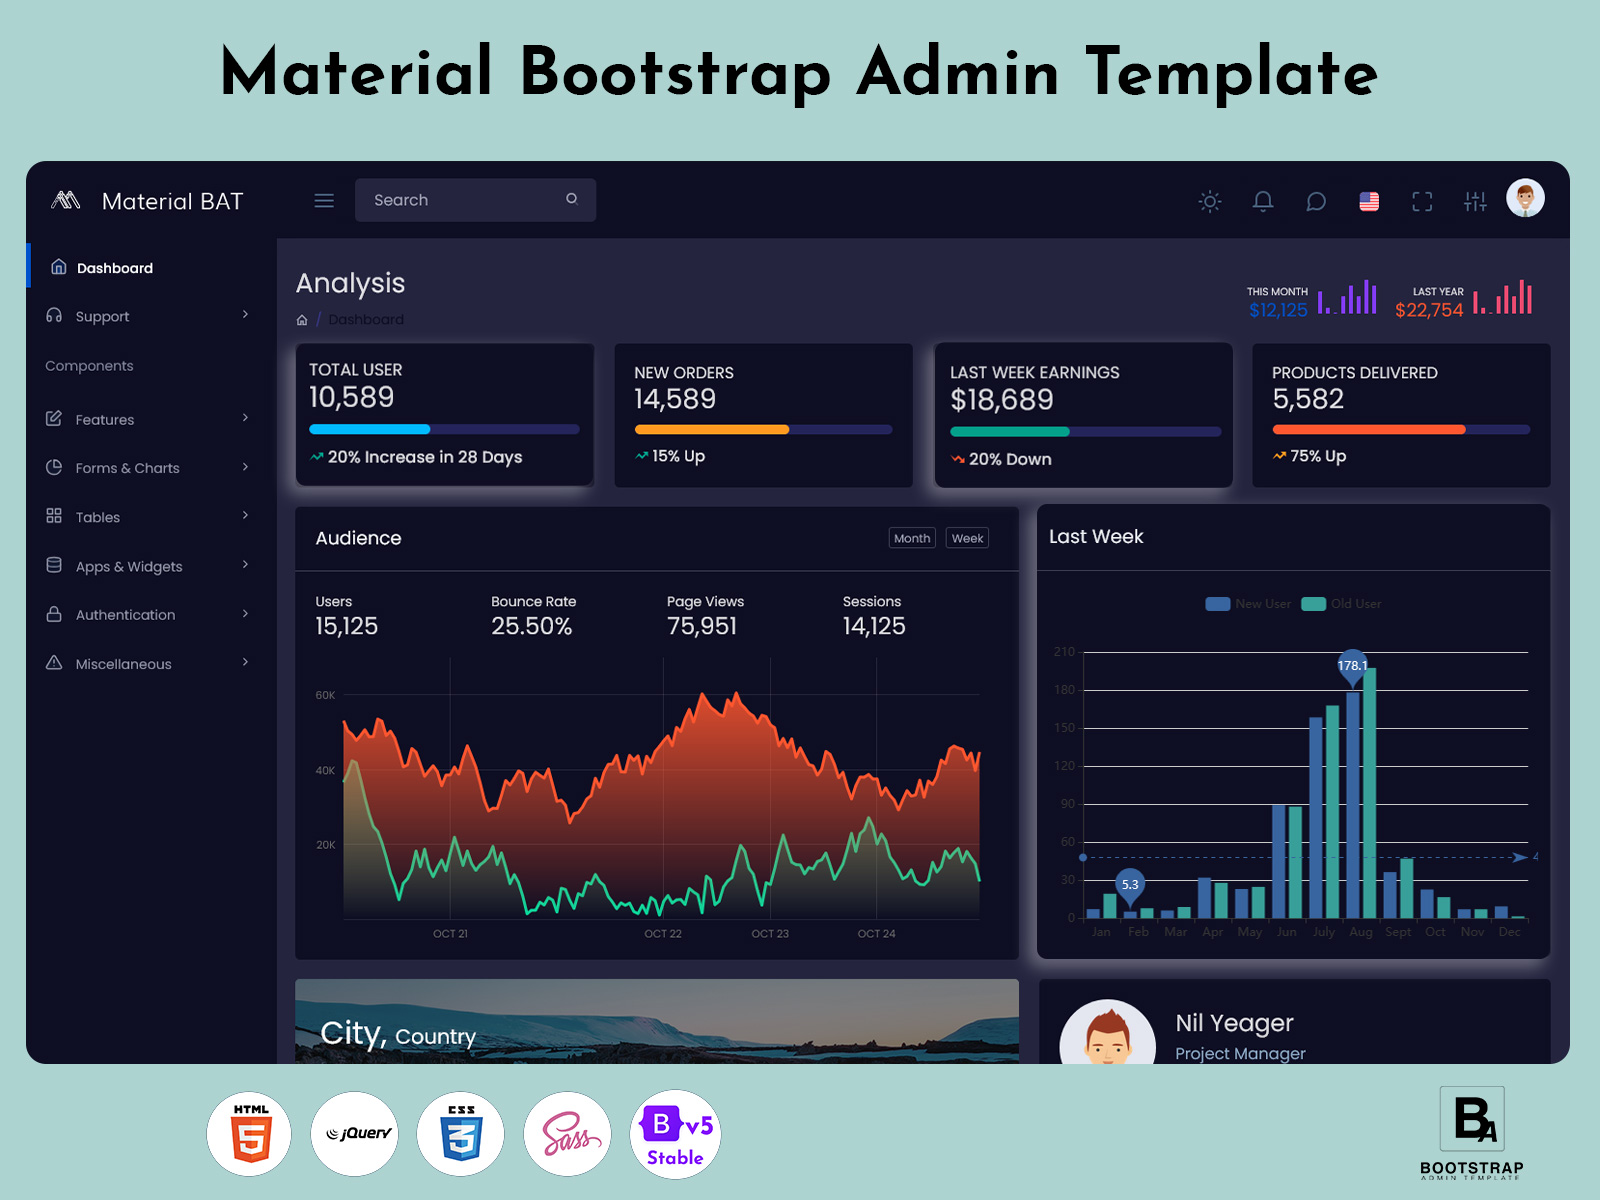
Dashboard of Analytics by Soft Material Admin
MORE INFO / BUY NOW DEMO
Charts are often the heart of any analytics dashboard, and we’ve gone the extra mile here. This Bootstrap Admin Template comes loaded with a wide range of analytical charts that cater to different data types and business needs. From line graphs that show sales trends over time to pie charts breaking down advertiser contributions, every chart is designed with user interaction in mind. The Traffic Sources Chart, for example, is a key component of the dashboard that highlights where your audience is coming from—whether it’s organic search, direct visits, or social media platforms. This single chart can offer invaluable insights into your marketing strategy’s effectiveness.
The dashboard layout is responsive and user-friendly across all devices. Whether you’re reviewing the day’s metrics on your laptop or checking in via your phone during a commute, the visual components adapt seamlessly. Each panel, widget, and chart is crafted to be both functional and aesthetically pleasing, making your workflow not only efficient but enjoyable.
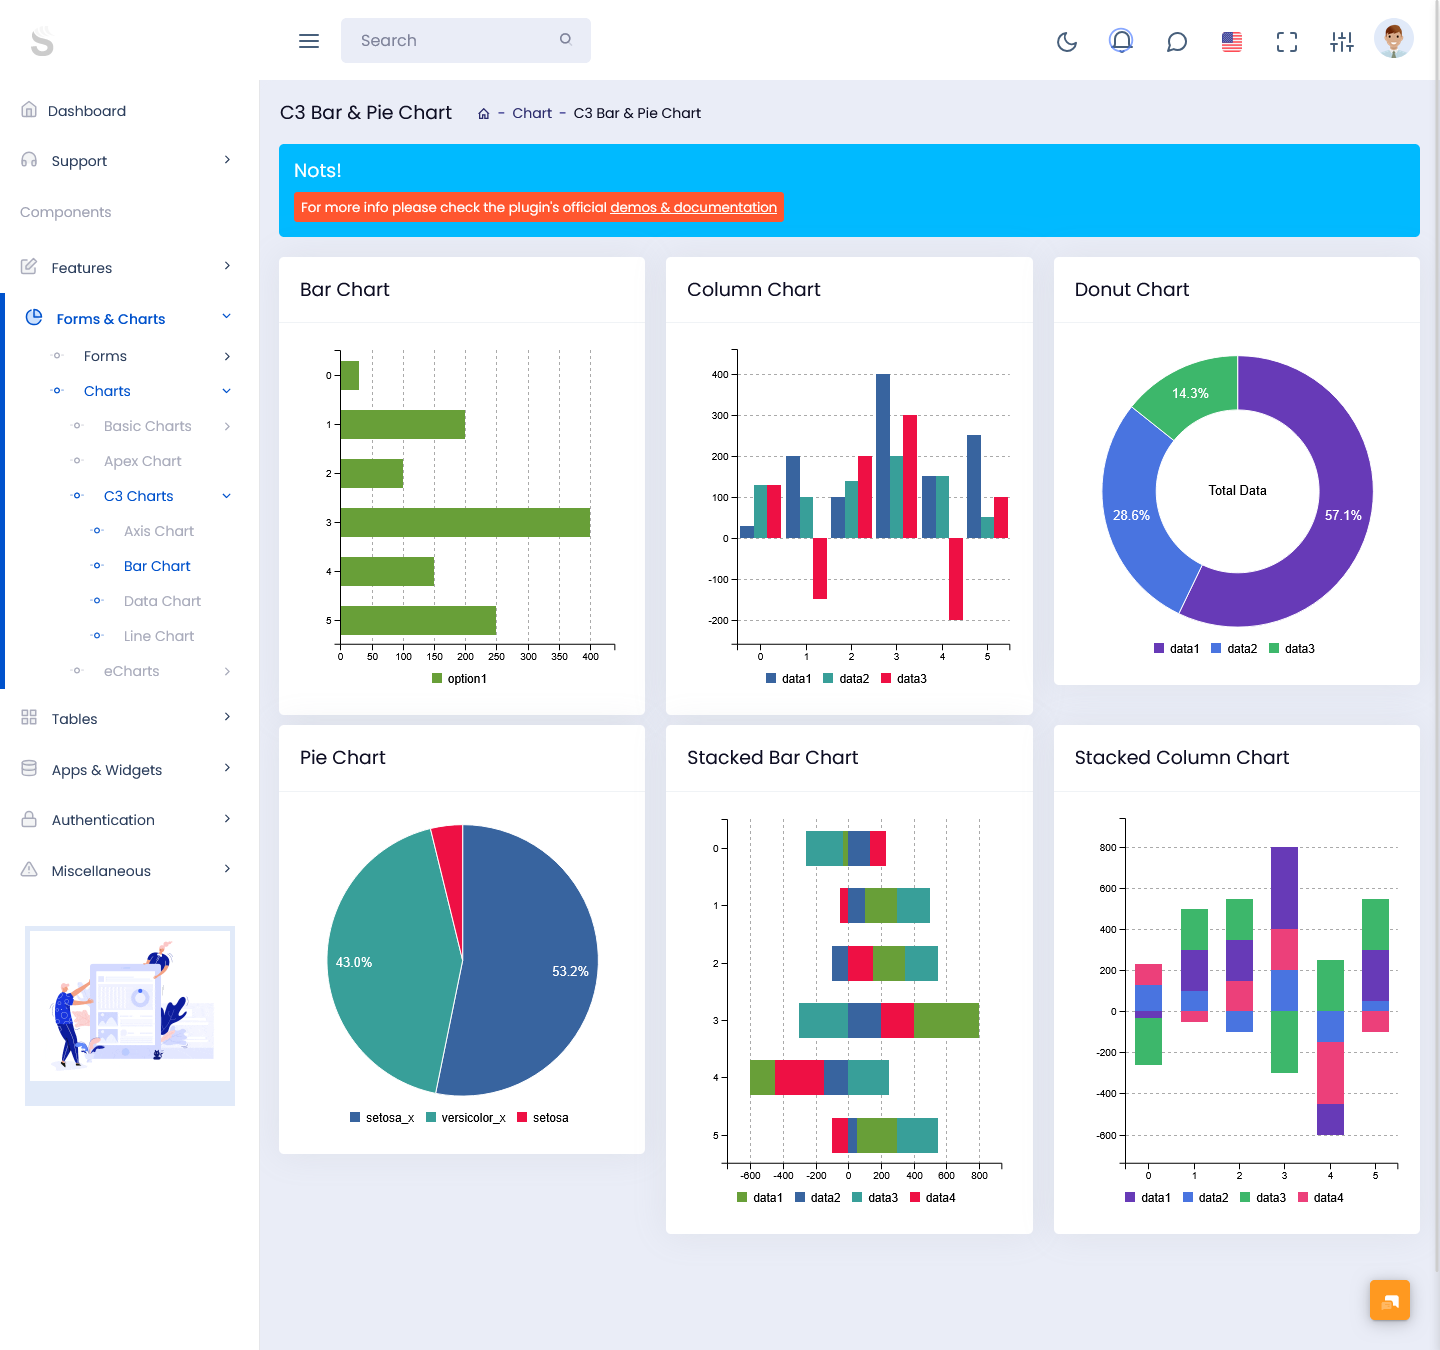
C3 Bar & Pie Chart
DEMO
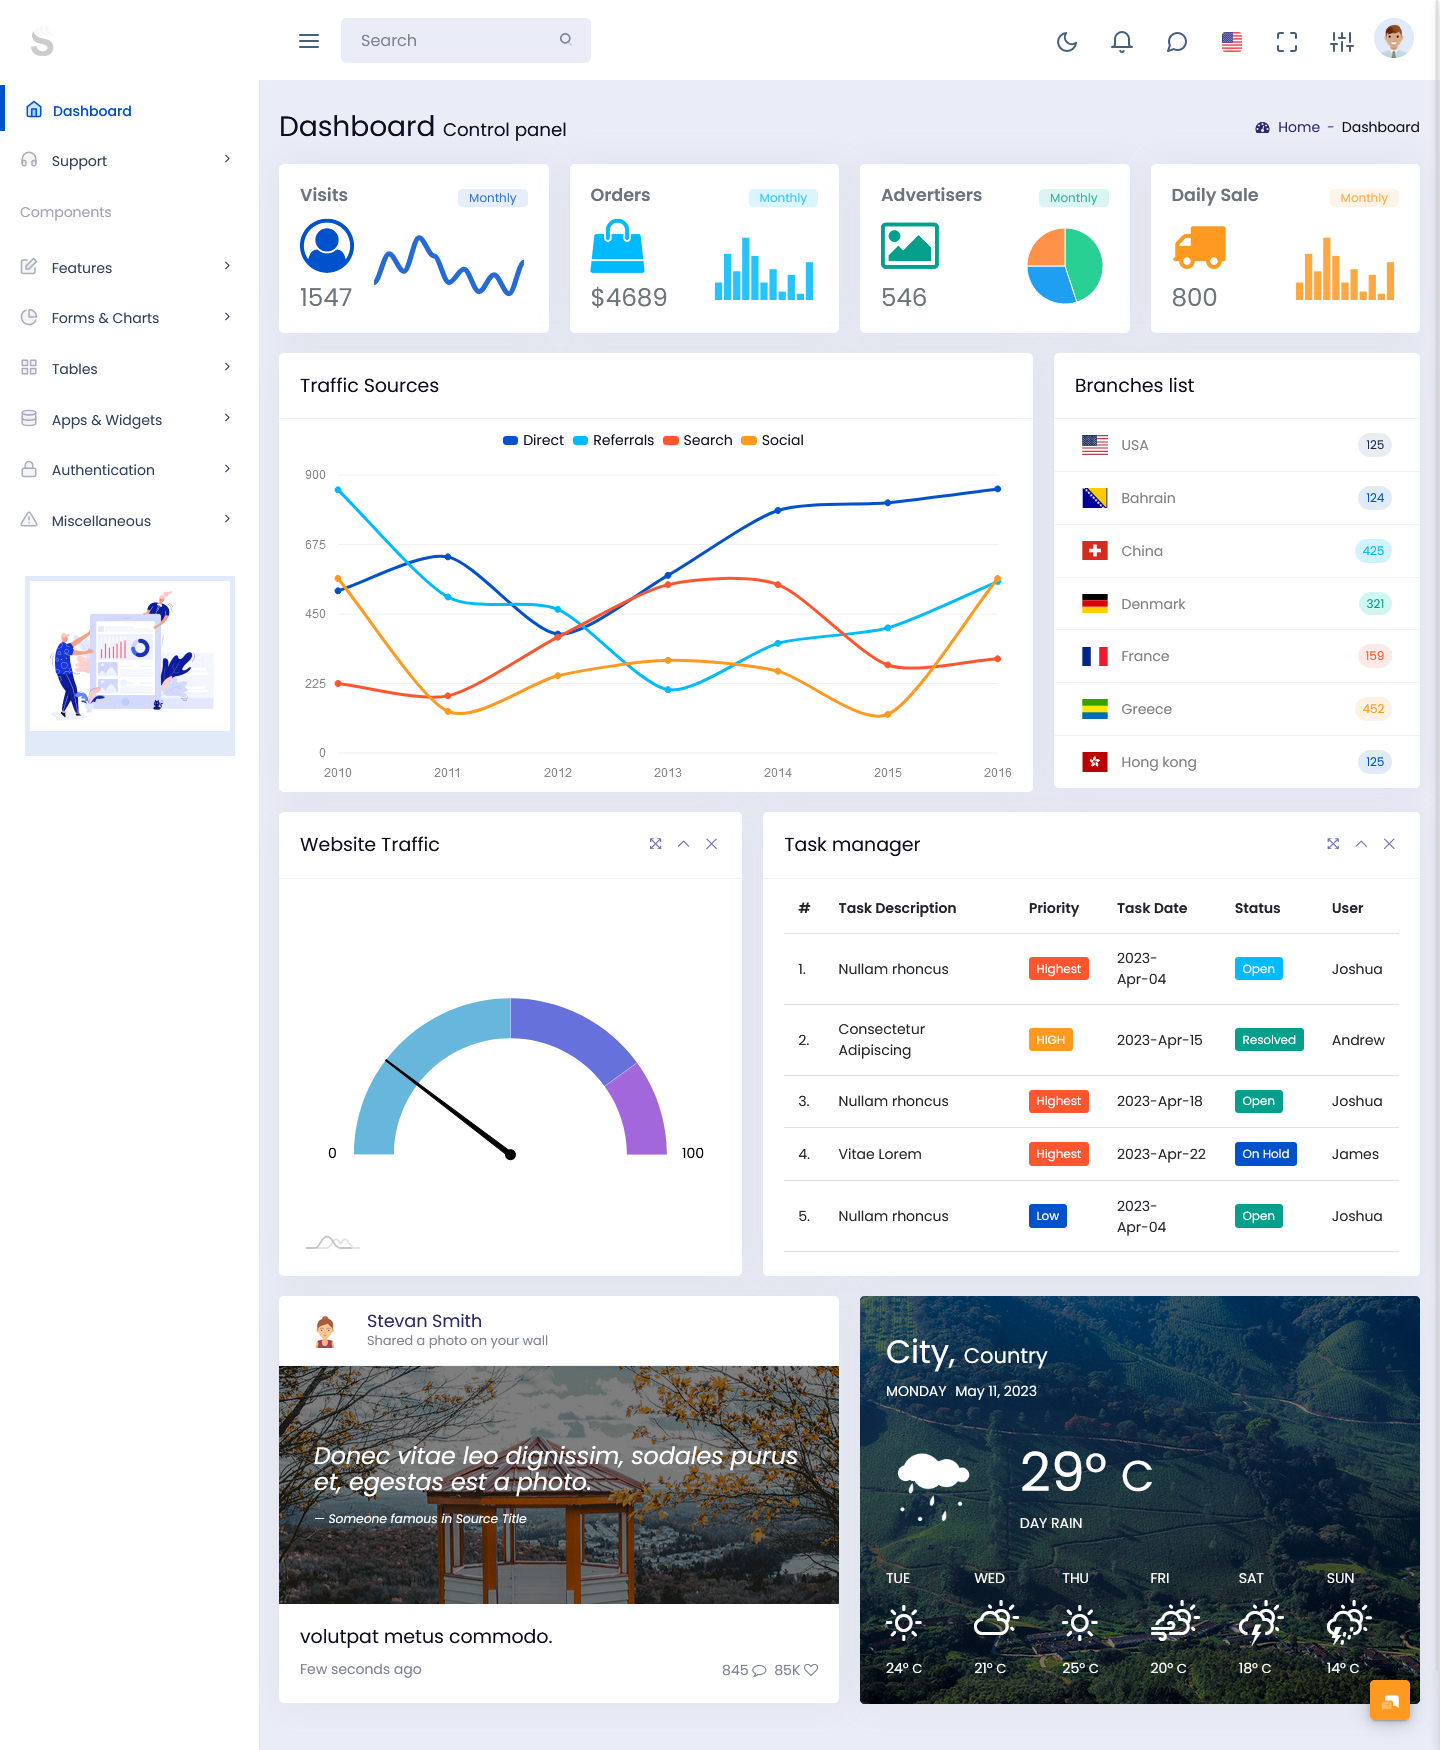
Our Analytical Dashboard doesn’t just provide metrics; it delivers context. Take the Website Traffic section, for instance. This area provides a detailed view of visitor behavior, letting users identify spikes, drops, and trends over different time frames. Combined with the control panel’s live updates, users can connect cause and effect with ease—such as identifying whether a new ad campaign has led to a surge in visitors or if an update has decreased bounce rates.
One of the lesser-known but incredibly useful features is the Task Manager embedded right into the dashboard. In most analytics environments, tasks are scattered across platforms—one for data, another for team collaboration, and yet another for task tracking. Our solution brings it all together. You can track what’s been done, what’s pending, and what’s overdue without leaving your analytics environment. It’s these kinds of thoughtful touches that turn a good dashboard into an indispensable tool.
And we haven’t forgotten about geographic diversity either. The Branches List is a handy module that helps teams with multiple offices or retail locations monitor activity branch-wise. This allows for performance comparisons and individual branch analysis without needing to switch between views or run separate reports. For companies that operate across regions, this feature can be a game-changer in decision-making.
Because data doesn’t exist in a vacuum, we’ve even included a weather widget within the dashboard. While this might seem like a simple addition, it can actually be incredibly helpful for businesses where weather impacts operations, such as retail, logistics, or events. Knowing what’s happening outside can provide valuable context for interpreting trends in your data.
Behind all this functionality is a robust Bootstrap foundation. This means that developers can easily extend, modify, or integrate new components as needed. Whether you’re building an enterprise-grade analytics tool or a customized performance dashboard for a small team, the underlying code is clean, well-documented, and highly adaptable.
At its core, our Analytical Dashboard is designed for usability. Every button, every chart, and every widget has been placed with purpose. We know that in the world of analytics, time is often short and the margin for error is slim. That’s why our layout emphasizes visibility, speed, and control. You don’t have to fumble through menus or toggle between endless screens. Everything you need is right where you expect it to be.
When we set out to build this template, we didn’t want to create just another admin dashboard. We wanted to offer something that genuinely helped people understand and act on their data. And that’s exactly what this Analytical Dashboard delivers. It’s not just about tracking numbers—it’s about seeing the bigger picture clearly and quickly.
So whether you’re an analyst trying to interpret complex datasets, a marketing lead reviewing traffic sources, or a developer looking to integrate data visualizations into a client project, our dashboard provides all the tools you need in one cohesive environment. The power of analytical charts, combined with a smart dashboard layout, creates a user experience that is as functional as it is visually appealing.
If you’re looking for a dashboard that truly puts analytics first, look no further. This is more than a template—it’s a comprehensive solution for anyone serious about data. Our Analytical Dashboard isn’t just a tool; it’s your new command center for data-driven success.
For more premium Bootstrap Admin Templates, please visit our website. Explore a wide range of powerful and customizable dashboards tailored to your needs!
Bootstrap Admin Template