The Power of an Analytical Dashboard for Better Decisions
Making informed decisions is crucial to the success of any business. Analytical dashboard is essential tools that transform raw data into actionable insights. These dashboards provide a visual representation of complex data, helping businesses analyze trends, track key performance indicators (KPIs), and make decisions that drive growth.
What is an Analytical Dashboard?
An analytical dashboard is a tool that helps businesses monitor, analyze, and interpret data in a visual format. It is designed to help users track key metrics like sales data, marketing performance, and customer behavior. Unlike other dashboards, analytical dashboards focus on identifying trends and answering the “why” behind the numbers. By using analytical charts such as bar graphs, line charts, and pie charts, users can quickly spot trends, patterns, and opportunities that would otherwise remain hidden in raw data.
Key Components of an Analytical Dashboard
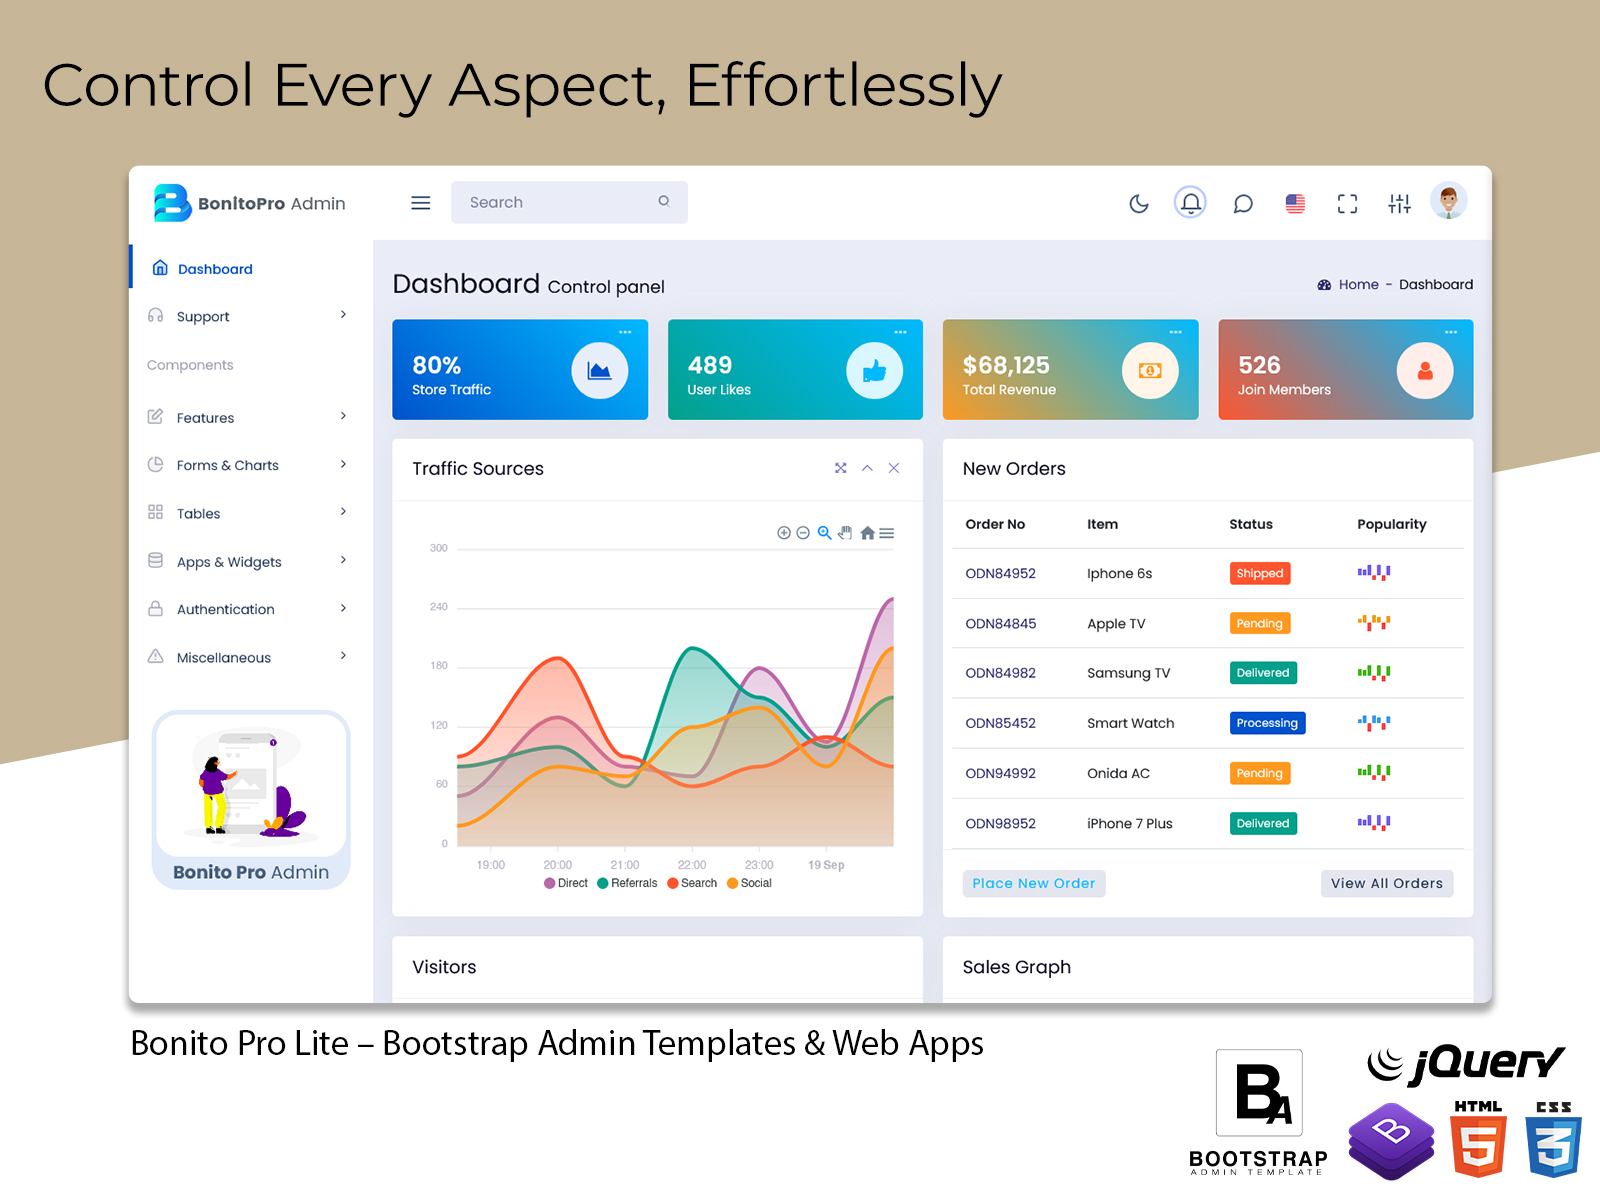
To effectively track and analyze data, an analytical dashboard typically includes various components. These components include analytical charts like graphs and tables, which provide users with detailed views of the data. KPIs are essential for quickly assessing progress, and they can be displayed alongside dashboard UI elements for easy access. The design of your Admin Dashboard UI is important, as it determines how users interact with data and make decisions.
Benefits of Using This Dashboard
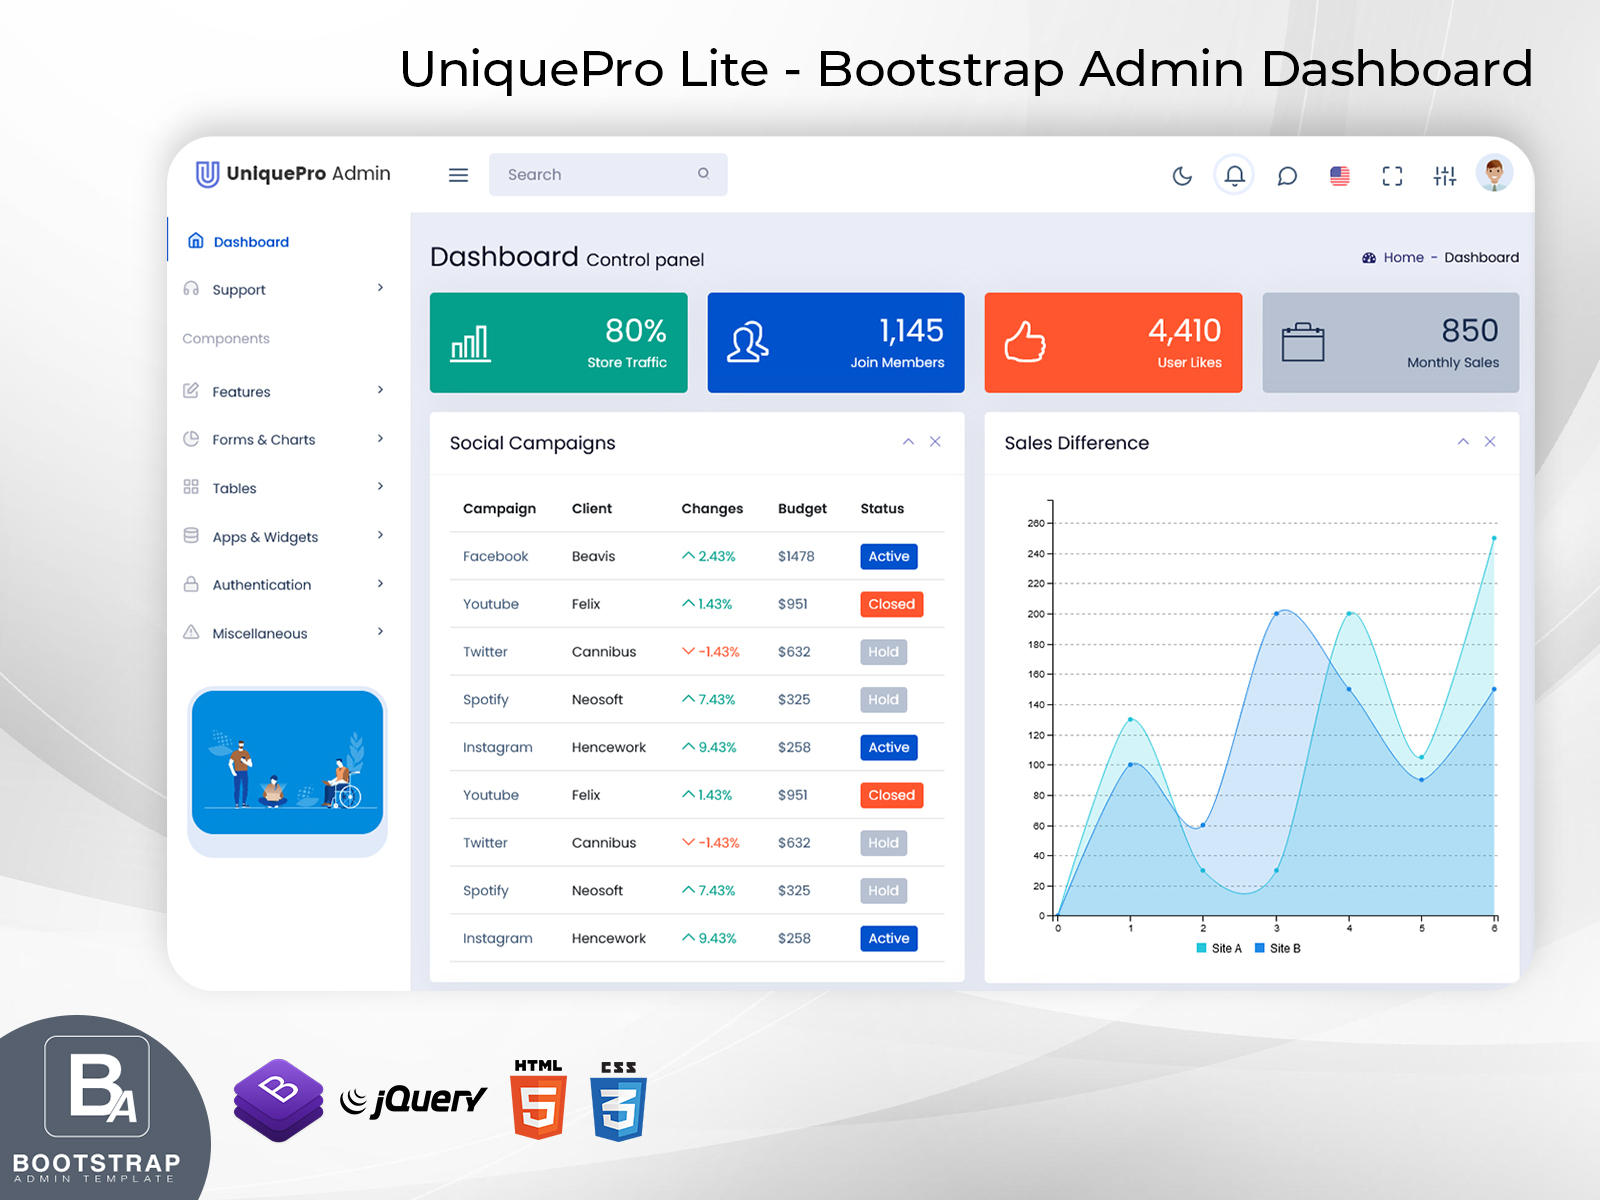
Using an analytical dashboard offers several key benefits. One of the main advantages is improved decision-making through data visualization. Visual tools like analytical charts make it easier for businesses to spot patterns and trends that can lead to better choices. For example, a Bootstrap Admin Template can be used to display a sales report with clear visuals, making it easy for decision-makers to analyze performance over time.
Additionally, admin templates, especially when built with frameworks like Bootstrap 5 Admin Template, offer responsive designs that are customizable for different business needs. This flexibility ensures that businesses can tailor the admin dashboard UI to their specific requirements, enhancing user experience and boosting productivity.
Conclusion
In summary, analytical dashboards play a key role in transforming raw data into valuable insights. By using analytical charts, businesses can improve decision-making, boost efficiency, and uncover new growth opportunities. Whether you’re using a Bootstrap Admin Template or a custom-built solution, the power of data-driven decisions can significantly impact your business success. Start designing an effective admin dashboard UI today, and leverage the potential of Bootstrap 5 Admin Template to drive smarter business decisions.
Buy Now and Get Started Today!
Click below to purchase and start unlocking the full potential of your business!
BUY NOW