Understanding Bootstrap Admin Template – A Simple Guide
In today’s world, businesses need data to make smart decisions. One helpful tool for understanding and visualizing this data is the Bootstrap Admin Template. In this blog, we’ll explain what an analytical dashboard is, why it matters, the benefits it offers, and the important metrics you can track with it.
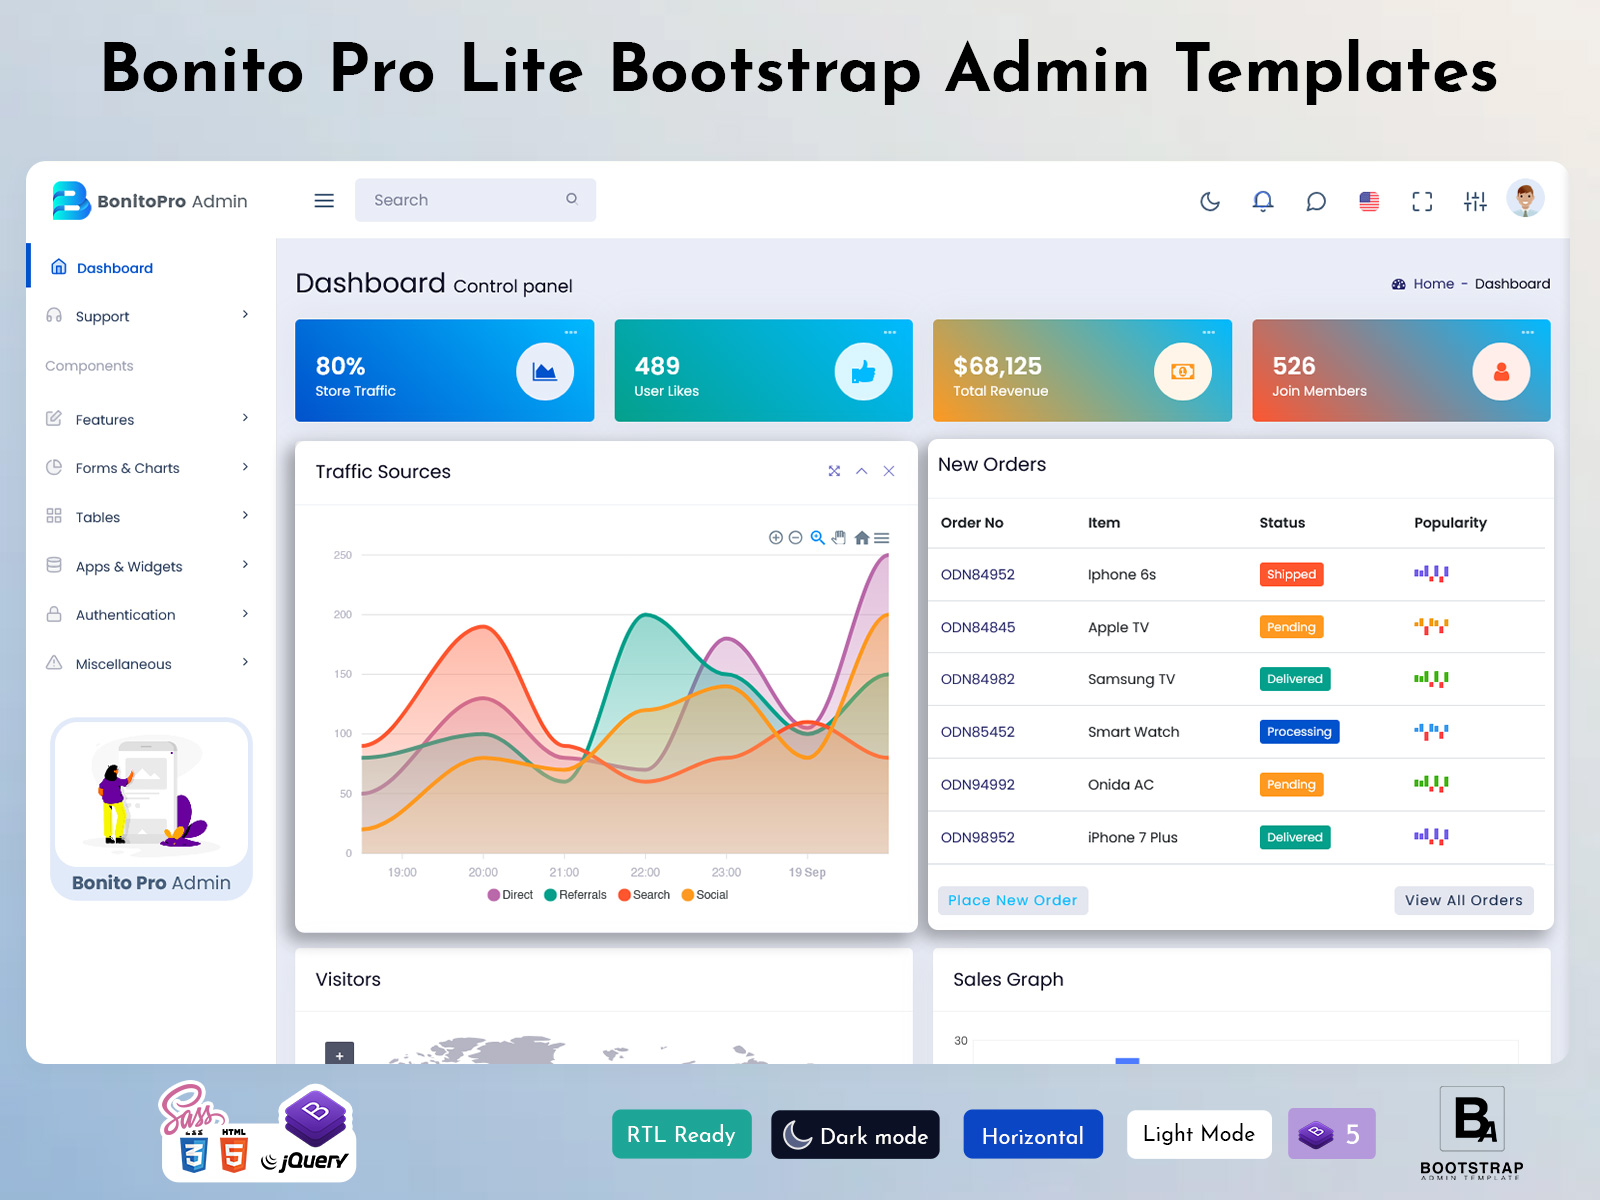
Bonito Pro Admin
BUY NOW

What is an Admin Template?
An Admin Template is a visual display that organizes and presents important data in a clear and understandable way. It gathers information from various sources and displays it in one place, allowing users to quickly assess performance and identify trends.
Typical features of a Dashboard Template include:
– Store Traffic: This shows how many people visit your store or website.
– User Likes: This metric tracks how many users have liked your products or services on social media or your site.
– Total Revenue: This indicates the overall income generated during a specific time period.
– Join Members: This tracks how many new members or customers have signed up.
– Traffic Sources: This reveals where your visitors are coming from, such as search engines, social media, or direct visits.
– New Orders: This shows the number of orders placed within a specified timeframe.
– Visitors: This counts the unique visitors to your site or store.
– Sales Graph: A visual representation of sales trends over time.
– Sales: This indicates total sales revenue generated.
– Returns: This tracks the number of products returned by customers.
– Visits: This shows the total number of times users visit your site.
By consolidating this information, a Dashboard Template provides a clear overview of business performance.
Dashboards of Bonito Pro Admin
LTR Style – Dashboard – Light

MORE INFO / BUY NOW DEMO
LTR Style – Dashboard – Dark
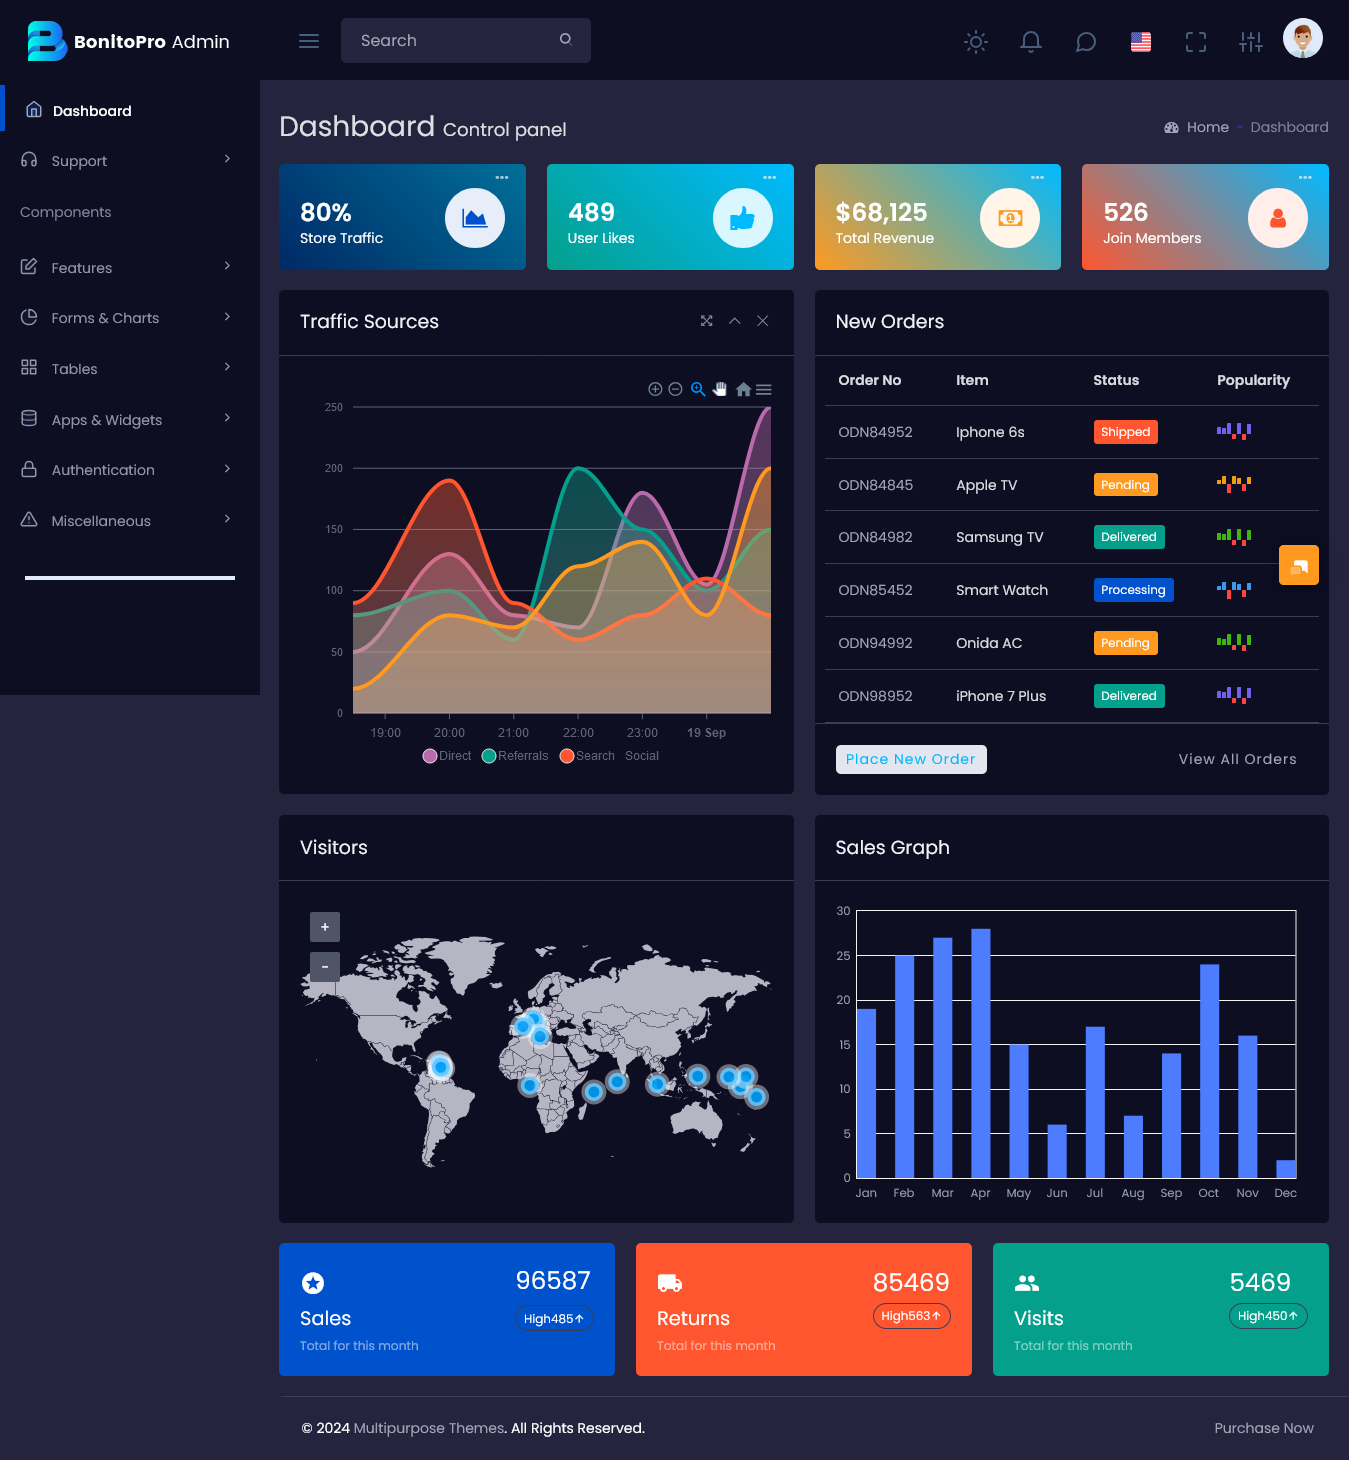
MORE INFO / BUY NOW DEMO
Why Use an Analytical Dashboard?
Using an analytical dashboard is crucial for several reasons:
-
Real-Time Insights
Analytical dashboards provide real-time data, allowing businesses to monitor performance instantly. This immediate access helps organizations respond quickly to market changes or customer behaviors.
-
Data Consolidation
Instead of digging through multiple reports and spreadsheets, an analytical dashboard brings all important metrics together. This saves time and reduces errors that can occur when transferring data between different sources.
-
Informed Decision-Making
With key metrics readily available, businesses can make better decisions. Whether it’s adjusting marketing strategies, changing product offerings, or planning new campaigns, having accurate data enables informed choices.
Benefits of Using an Analytical Dashboard
The advantages of using an Admin Template extend beyond just tracking performance. Here are some key benefits:
-
Improved Visibility
An analytical dashboard provides a clear view of your business’s performance. You can easily see where you stand with your goals, which helps you focus on areas that need improvement.
-
Performance Monitoring
With an analytical dashboard, you can track performance over time. By analyzing trends, you can identify patterns and make adjustments. For example, if you notice a drop in store traffic, you can investigate the cause and implement changes.
-
Increased Accountability
When team members can see their performance data, it fosters accountability. Everyone understands how their efforts contribute to the overall success of the business, motivating them to perform better.
-
Customizable Insights
Many analytical dashboards allow customization, enabling you to focus on the metrics that matter most to your business. Whether it’s customer demographics, sales trends, or traffic sources, you can tailor the dashboard to meet your needs.
-
Enhanced Collaboration
Analytical dashboards can be shared across teams, promoting collaboration and communication. When everyone has access to the same data, it’s easier to discuss strategies and work towards common goals.
Key Metrics to Track on an Bootstrap Admin Template
When setting up an Bootstrap Admin Template, here are some important metrics to consider tracking:
-
Store Traffic
This metric shows how many visitors come to your store or website. Understanding traffic patterns helps you gauge customer interest and adjust marketing strategies accordingly.
-
User Likes
Tracking user likes on social media or your website indicates how well your products or content resonate with your audience. Higher likes can suggest successful engagement strategies.
-
Total Revenue
This is a critical metric that shows the total income generated from sales. Monitoring revenue helps assess the financial health of the business.
-
Join Members
Tracking how many new members or customers join helps you understand your growth rate and the effectiveness of your marketing campaigns.
-
Traffic Sources
Knowing where your visitors come from allows you to evaluate the success of different marketing channels. Are they coming from social media, search engines, or referrals? This information helps optimize marketing efforts.
-
New Orders
Monitoring new orders gives insights into customer purchasing behavior. An increase in orders can indicate successful promotions or high-demand products.
-
Visitors
Counting unique visitors provides an understanding of your audience size. This metric helps in assessing the reach of your marketing campaigns.
-
Sales Graph
Visualizing sales trends over time helps identify patterns, such as seasonal peaks or declines. This information is valuable for planning future sales strategies.
-
Sales
This metric summarizes total sales revenue, providing a snapshot of overall performance. Regular monitoring helps track progress towards financial goals.
-
Returns
Tracking the number of product returns is essential for understanding customer satisfaction. A high return rate may indicate quality issues or mismatched customer expectations.
-
Visits
This shows the total number of times users visit your site. High visit counts, especially from unique users, can signal a successful marketing effort or trending products.
Who Can Benefit from a Bootstrap Admin Template?
Bootstrap Admin Templates are beneficial for various roles within a business:
-
Sales Teams
Sales professionals can use dashboards to track their performance, monitor leads, and assess conversion rates. This information helps prioritize efforts and improve sales techniques.
-
Marketing Teams
Marketing teams can analyze the effectiveness of campaigns by looking at traffic sources, new registrations, and user engagement. This data helps refine marketing strategies.
-
Management and Executives
Leaders use analytical dashboards for a high-level overview of business performance. They can quickly assess whether goals are being met and make strategic decisions based on real-time data.
-
Finance Teams
Finance professionals can track total revenue and returns, which is crucial for budgeting and forecasting. This helps maintain the financial health of the organization.
-
Customer Support Teams
Customer support can benefit from understanding user behavior and engagement. This insight helps them improve service and better address customer needs.
How to Create an Effective Analytical Dashboard
If you’re considering implementing an analytical dashboard, here are some steps to get started:
-
Identify Key Metrics
Determine what data is most important for your business. What metrics do you need to track? Focus on those that align with your goals.
-
Choose the Right Tool
There are many dashboard tools available. Look for one that offers the features you need and is user-friendly. Popular options include Google Data Studio, Tableau, and Microsoft Power BI.
-
Customize Your Dashboard
Once you select a tool, customize the dashboard to display the metrics you identified. Organize the information in a way that makes sense for your team.
-
Train Your Team
Ensure your team knows how to use the dashboard effectively. Provide training or resources to help them understand how to interpret the data.
-
Review and Adjust Regularly
Regularly check the data in your analytical dashboard. Look for trends and be ready to make adjustments based on what you observe. Continuous analysis helps you stay on top of your performance.
Conclusion
An Admin Template is a vital tool for businesses looking to harness the power of data. It provides real-time insights, consolidates important metrics, and enhances decision-making. By using an analytical dashboard, organizations can monitor performance, improve accountability, and drive growth.
If you haven’t started using an analytical dashboard yet, consider implementing one to gain valuable insights into your business. With the right data at your fingertips, you’ll be better equipped to make informed decisions and achieve your goals. Embrace the power of analytics and watch your business thrive!
This admin template is perfect for managing everything in one place. It’s user-friendly, clean, and customizable. I love how easy it is to navigate through the dashboard!
I’ve tried many admin templates, but this one stands out. It’s easy to integrate, looks sleek, and has all the features I need to manage my data effortlessly.
The design is beautiful, and it has all the features I need for organizing my business data. It’s also responsive, which makes it a breeze to use on any device.
This admin template is an excellent tool for handling multiple projects. It’s highly customizable, and the layout is clean and intuitive, making it easy to stay on top of everything.
I was amazed at how simple it is to use while still being incredibly powerful. The analytics tools are very useful, and everything is well-organized for easy access. Highly recommend!
This admin template provides amazing value for the price. It’s packed with features, yet the design doesn’t feel cluttered. Highly functional and great for managing data on any business platform.
This is one of the best admin templates I’ve used. It has a great dashboard with easy-to-use controls, customizable options, and perfect for tracking user data and performance metrics.
I love how modern and sleek this template looks. The fact that it’s so easy to customize makes it a great choice for any business. Perfect for a professional admin panel.
The real-time analytics and performance tracking features have been a real time-saver. The dashboard provides everything I need in a well-organized layout. So efficient!
I’m really happy with this admin template. It’s simple to set up, the design is clean, and it makes managing all aspects of my business much easier. Perfect for daily use.