Bootstrap Dashboard Template: Enhance Your App’s UI and UX – Minimal Pro
Minimal Pro – Bootstrap Dashboard Template provides pre-built layouts and components, saving developers time and effort in designing and coding the dashboard from scratch. This Admin Dashboard UI Kit is inherently responsive, ensuring that the dashboard adapts seamlessly to different screen sizes and devices. A Bootstrap dashboard template can significantly streamline the development process and enhance the user experience of your application. By leveraging the pre-built layouts, components, and responsive design features of Bootstrap, you can create a visually appealing and user-friendly dashboard that meets the needs of your users. the benefits of using a Admin Dashboard UI Kit far outweigh the effort required for customization. To purchase our Bootstrap dashboard template, please visit our website
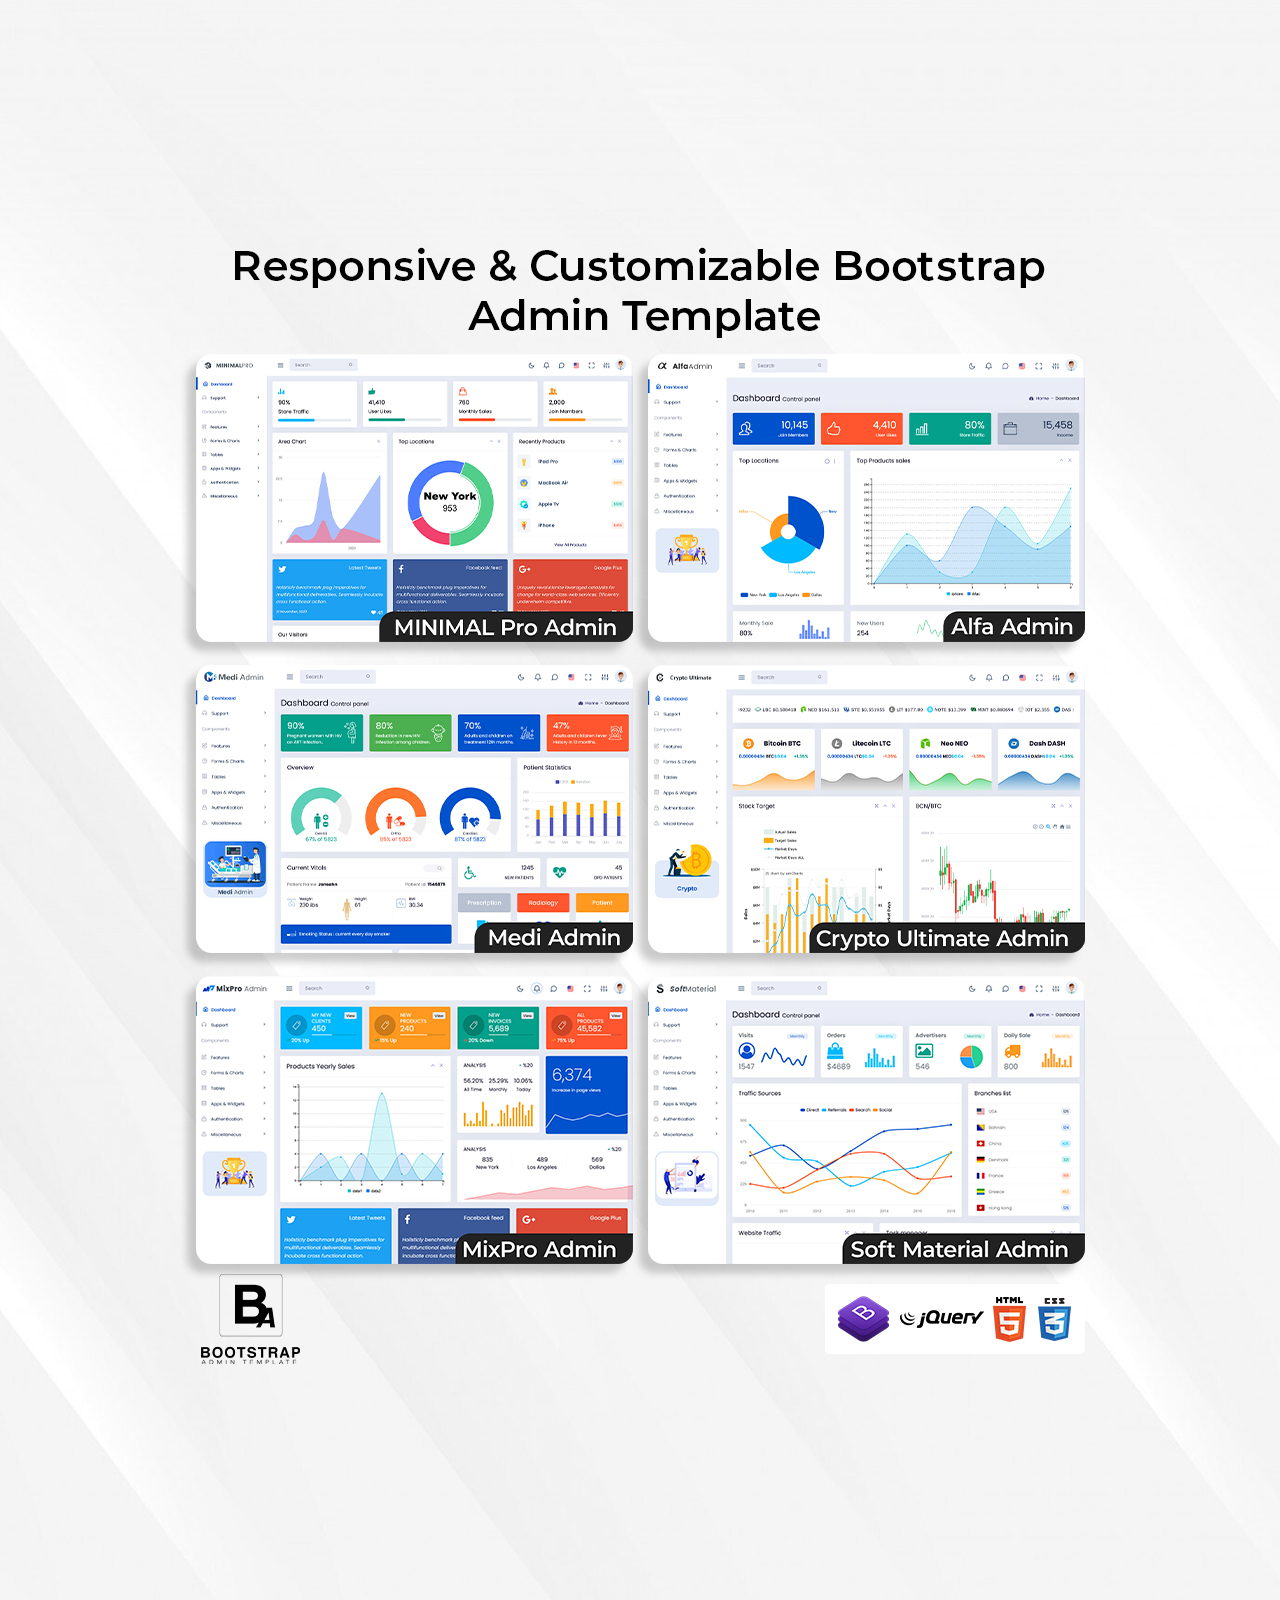
The Minimal Pro Bootstrap Admin Template offers administrators a streamlined view of essential business metrics, ensuring comprehensive oversight with detailed analytics on store traffic, user registrations, sales figures, and member sign-ups. Visual tools such as demographic areas and graphs highlight customer demographics and geographic trends, while real-time updates on current visitors and a World Map feature facilitate timely decision-making. Its minimalist design empowers businesses to optimize operations, enhance customer engagement, and foster sustainable growth effectively.
Bootstrap Admin Template
Minimal Pro Admin


Dashboard of Minimal Pro Admin
Main Dashboard

MORE INFO / BUY NOW DEMO
Mini Sidebar Dashboard
MORE INFO / BUY NOW DEMO
Dashboard of Minimal Pro Admin
Chats
MORE INFO / BUY NOW DEMO
Draggable Portlets
MORE INFO / BUY NOW DEMO
Chart Widgets
MORE INFO / BUY NOW DEMO
Invoice
MORE INFO / BUY NOW DEMO
Blog

MORE INFO / BUY NOW DEMO
Widgets

MORE INFO / BUY NOW DEMO
Mailbox

MORE INFO / BUY NOW DEMO
Buttons
MORE INFO / BUY NOW DEMO
Social
MORE INFO / BUY NOW DEMO
Minimal Bootstrap Admin Dashboard Features
1. Store Traffic Percentage-wise Results :- This section displays the distribution of traffic sources (like direct, referral, search) in percentages, providing insights into where your visitors are coming from.
2. Users Likes Numbers :- Shows the total number of likes or reactions users have given across your platform or specific content, helping gauge engagement.
3. Monthly Sales Numbers :- Graphically represents sales figures on a month-to-month basis, highlighting trends and performance over time.
4. Total Join Members Numbers :- Displays the cumulative count of members who have joined your platform or service, reflecting growth.
5. Area Chart Graph :- Visualizes data trends using an area chart, ideal for displaying changes in metrics over time such as sales, traffic, or user activity.
6. Top Locations Graph :- Illustrates where your audience or customers are geographically concentrated, aiding in targeted marketing efforts.
7. Current Visitors Graph :- Real-time or recent data on the number of visitors actively on your site or platform, crucial for operational insights.
8. World Map :- Provides a geographical overview, indicating user distribution or operational presence across different regions globally.
9. Direct Sale – Online Sale – Wholesale Graph :- Compares and contrasts sales figures across different sales channels (direct, online, wholesale), helping in strategic decision-making.
10. Social Media Accounts Feed :- Integrates feeds from various social media platforms (like Facebook, Twitter, Google) directly into the dashboard, keeping you updated on social engagement and trends.
11. Recently Products Details :- Highlights recently added or popular products/services, along with key details like sales performance or customer feedback.
12. Direct Chat :- Enables direct communication or messaging, facilitating quick interactions between admin and users or among team members.


