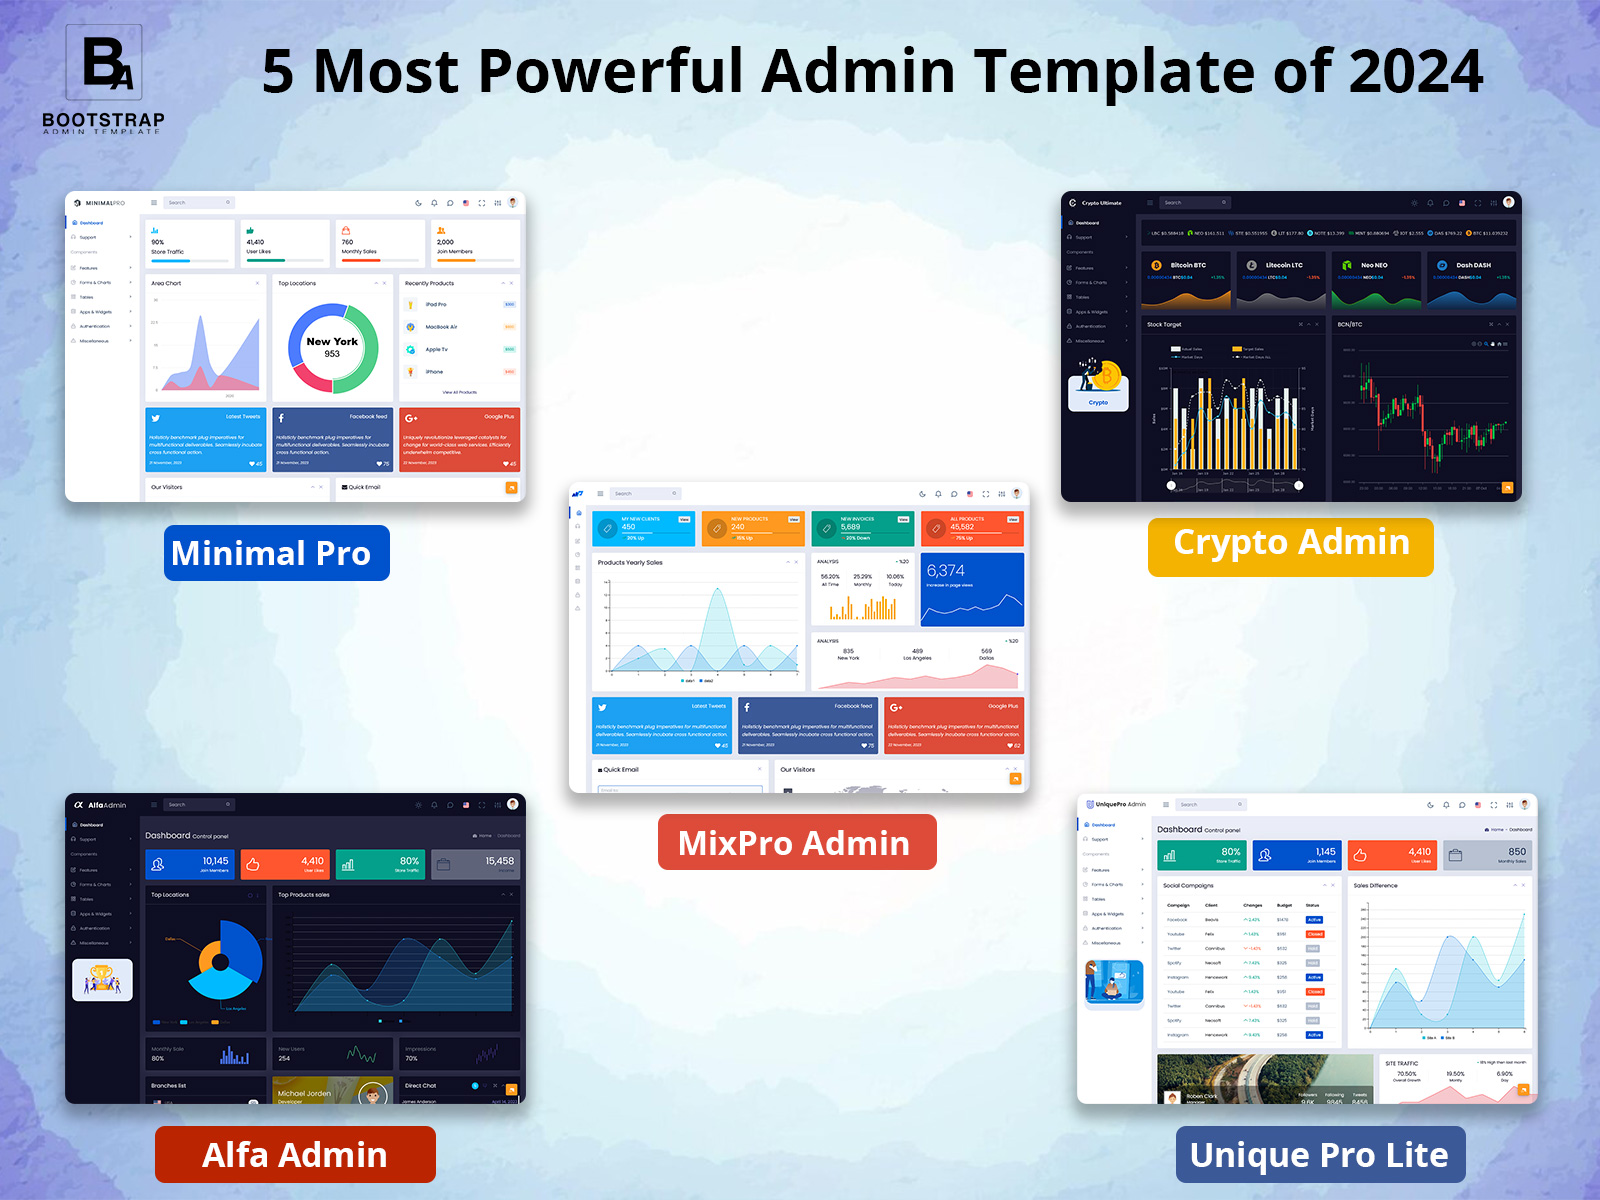
Admin Template That Makes Your Dashboard Simple and Clear
The Admin Template brings together the core business Analytics that teams rely on every day. Instead of digging through spreadsheets or switching between multiple tools, this Admin Template places essential information in one organized layout. It gives a clear snapshot of activity across users, orders, earnings, and product delivery. The focus is on clarity and function, nothing complicated, nothing overloaded, just a layout that lets you see what matters right away. Many teams use this Admin Template to monitor growth, track trends, and keep an eye on performance without wasting time searching for data. With this foundation, the Admin Template becomes a dependable companion for both daily tasks and long-term planning.
Explore Dashboard
.
BUY NOW DEMO
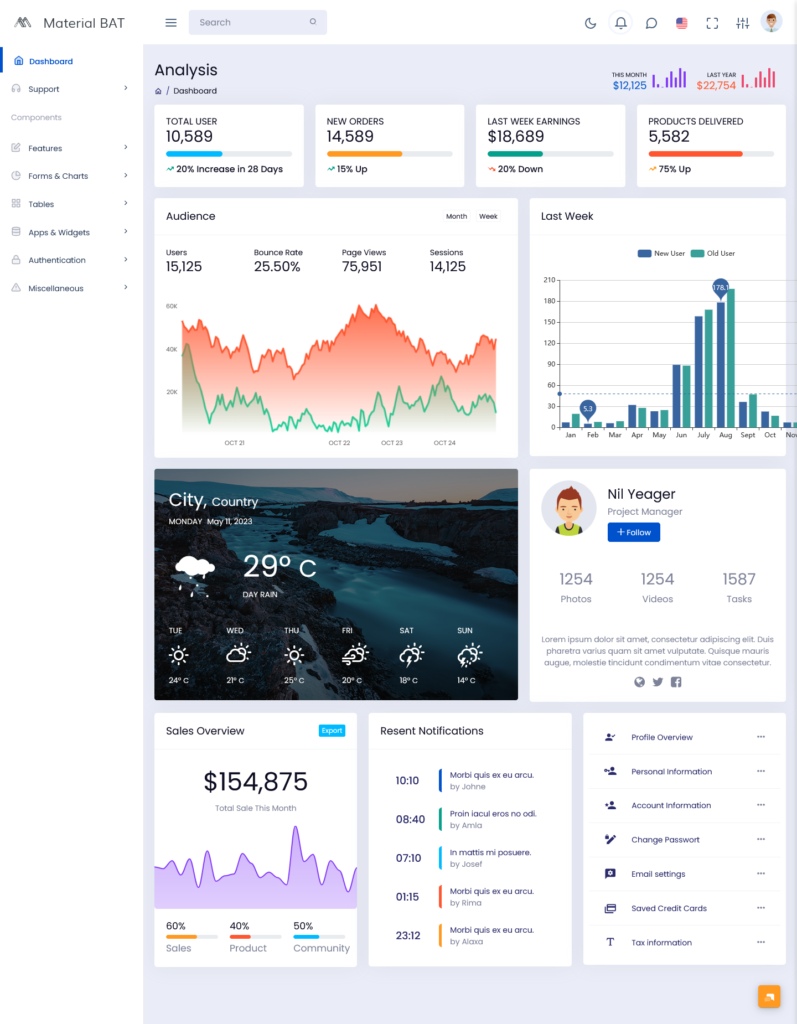
Key Metrics That Represent Your Business Activity
1.1 Total Users
The Total Users section highlights the size of your platform’s audience. It reflects how many individuals have joined and represents the ongoing interest your business attracts. This simple number says a lot about your brand’s reach and your overall presence in the market.
1.2 New Orders
New Orders show active customer activity analytics. Every new order tells a story-someone discovered your product, trusted your service, and decided to buy. By keeping this number visible, the dashboard helps teams understand buying patterns and respond quickly to changes.
1.3 Earnings From Last Week
This figure displays your recent financial performance. With weekly earnings presented in a straightforward format, it becomes easier to compare revenue, identify slow periods, and recognize strong sales weeks. This is one of the areas where the Bootstrap Admin Template Analytics delivers clarity, making financial review simple and practical.
1.4 Products Delivered
A direct reflection of how well your fulfillment system is working. Delivered products indicate reliability, successful processing, and customer satisfaction. When this number rises steadily, it signals smooth operations across your supply chain.
2. Understanding Audience Behavior
2.1 Audience Metrics
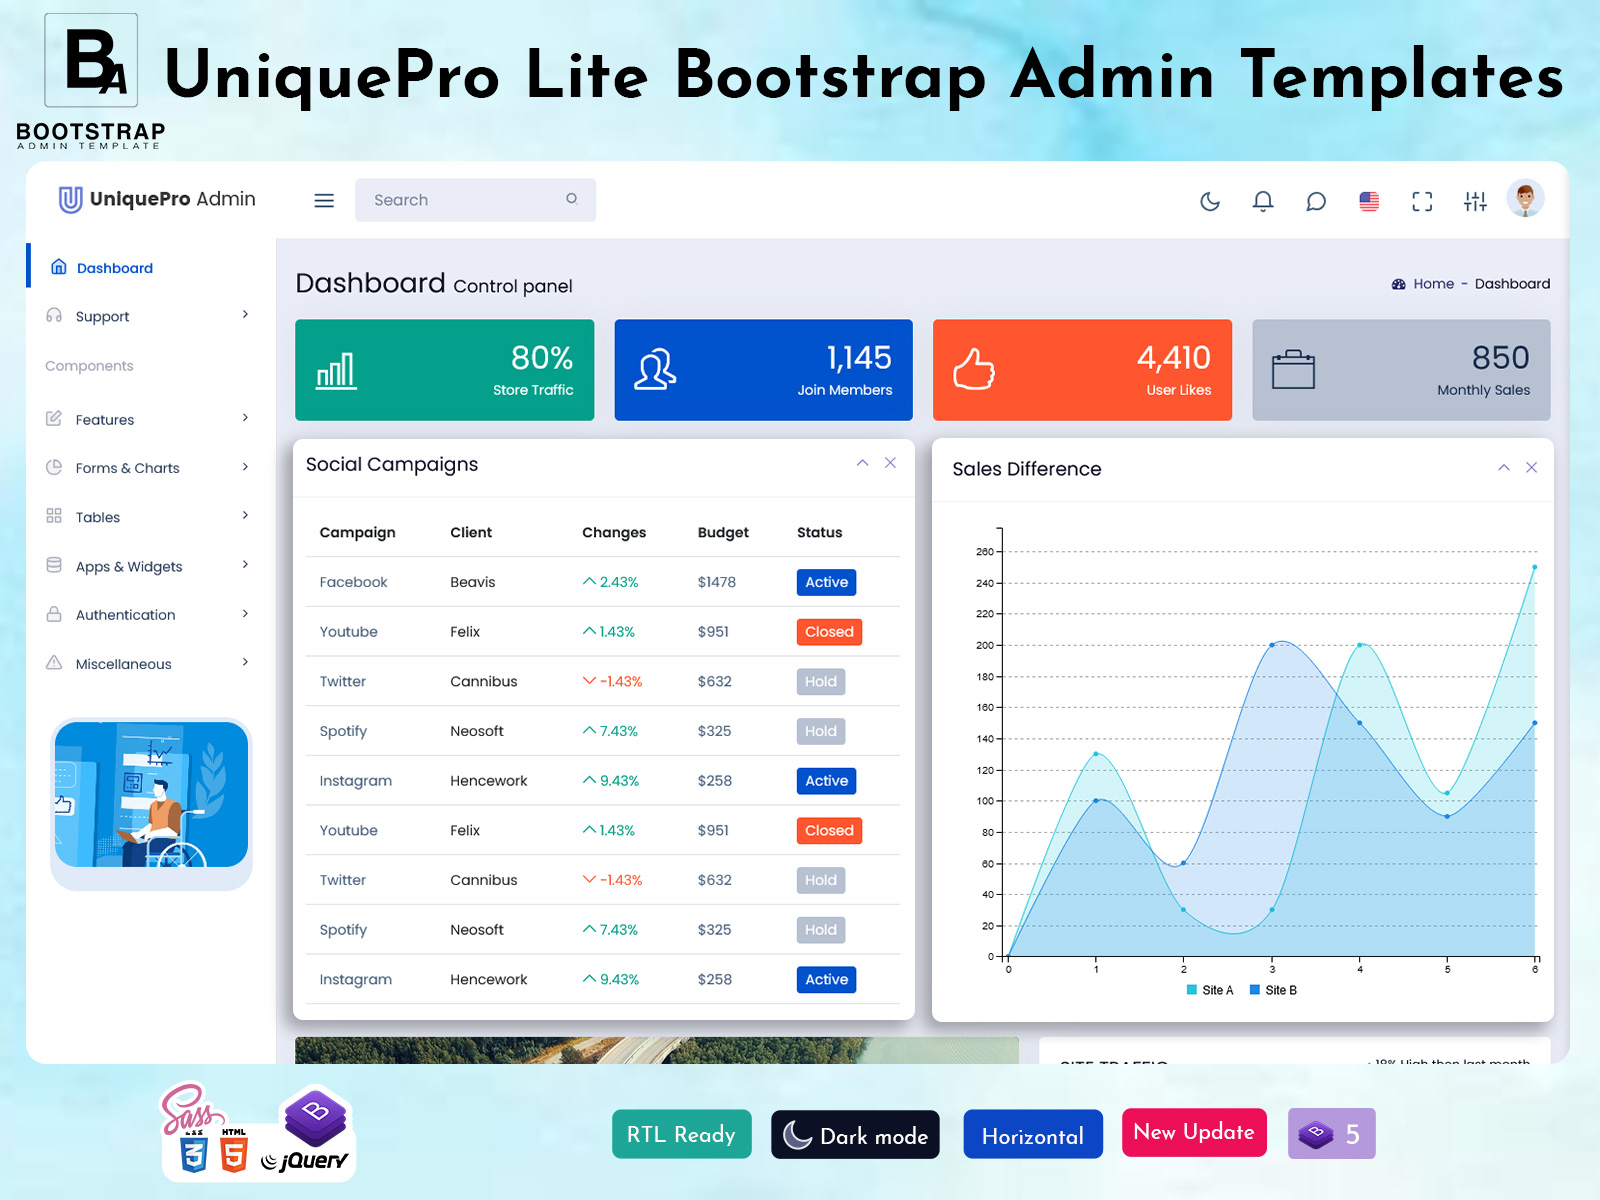
The dashboard provides a dedicated Audience Analytics section that gives a clear view of how visitors interact with your platform. Instead of guessing about user behavior, this section presents the key data points that matter most. The Premium Admin Dashboard shows trends in users, bounce rate, page views, and sessions in a simple, visual format. This allows teams to understand not only how many people are visiting the platform but also how they navigate through it, how engaged they are, and which pages are most effective at capturing attention.
2.2 User Growth and Engagement (Graph)
The graph in the Audience Metrics section compares new and returning users over the last week, alongside bounce rate, page views, and session counts. This multi-layered view provides several insights at once:
- Users: Shows the total traffic and how it changes day by day.
- Bounce Rate: Indicates the percentage of visitors leaving after viewing only one page, helping identify areas that need improvement.
- Page Views: Highlights which pages attract the most attention and engagement.
- Sessions: Tracks the number of visits to the platform, revealing overall activity levels and repeat engagement.
By including these four metrics in a single visual, the Dashboard Admin Template helps administrators quickly understand both the quality and quantity of audience interactions. Teams can see whether new visitors are exploring the platform fully or leaving quickly, and identify which pages or features drive the most engagement. The combined analysis makes it easier to make informed decisions about content, navigation, and marketing strategies.
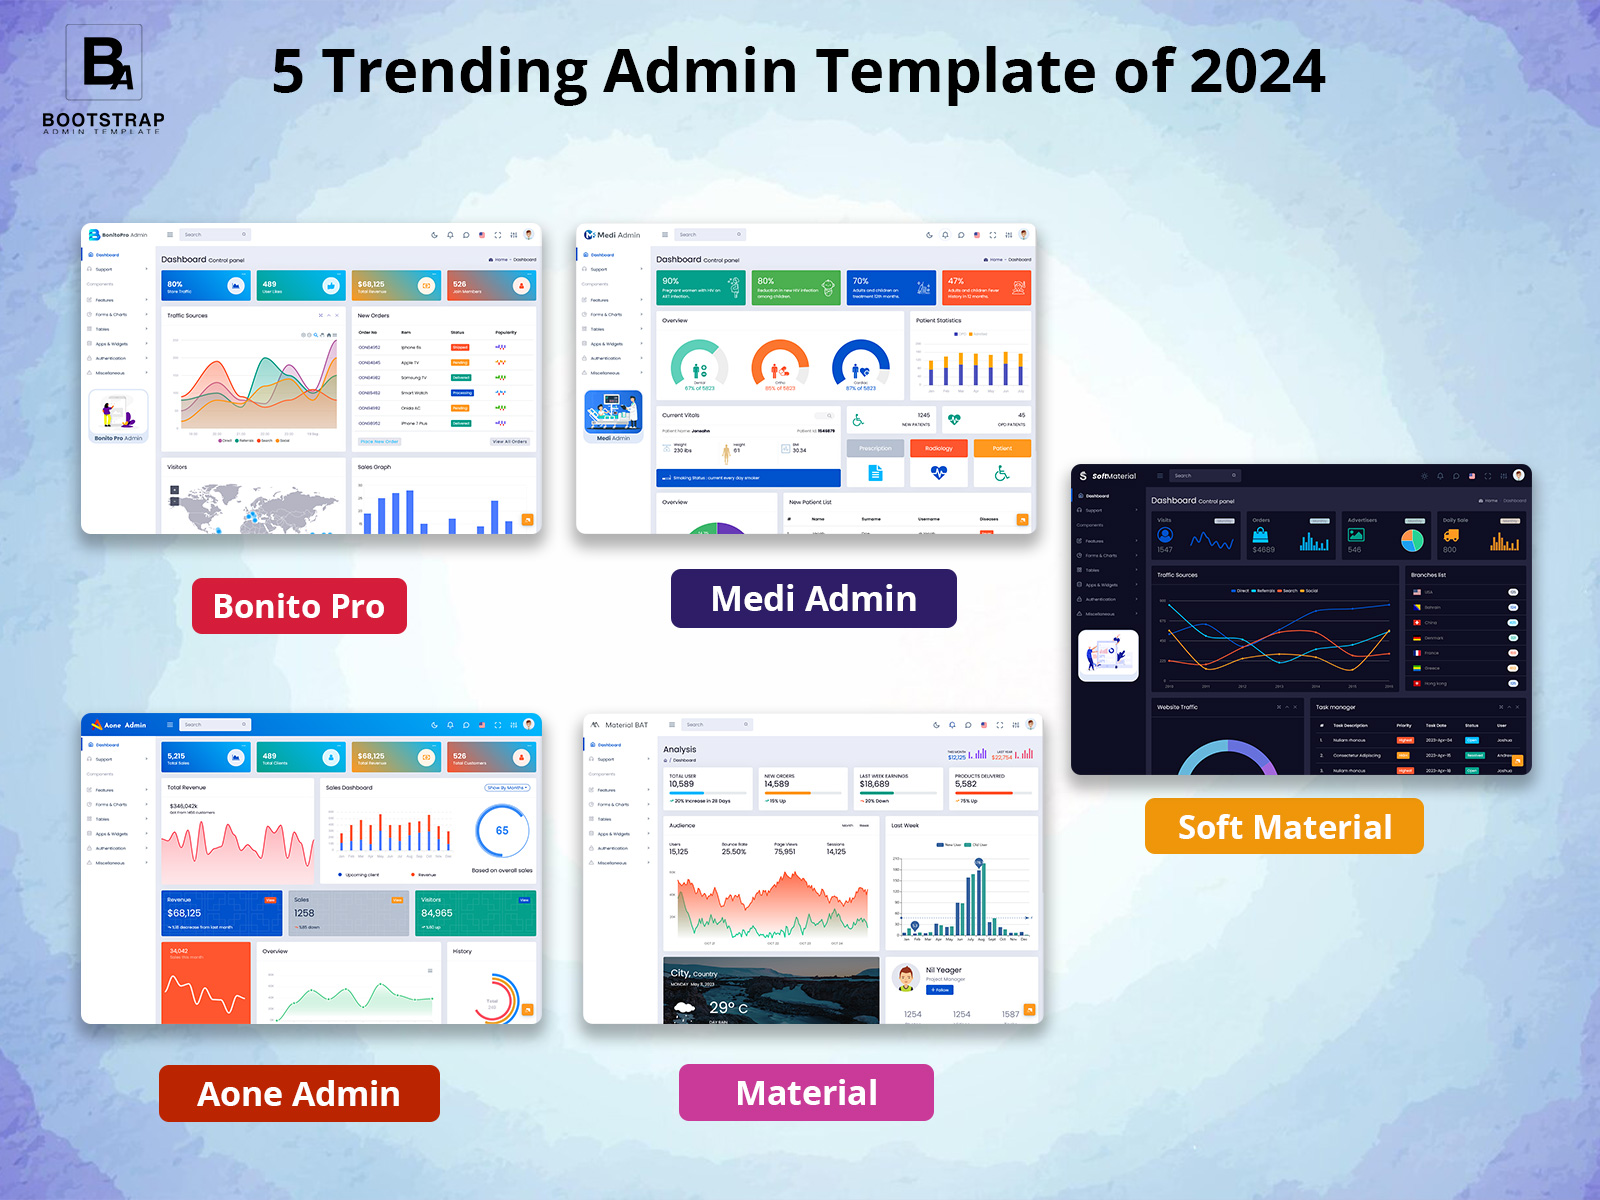
Other Style Dashboard
Dark Dashboard
BUY NOW DEMO
Mini Sidebar Dashboard
BUY NOW DEMO
Horizontal Dashboard
BUY NOW DEMO
3. Sales Overview and Performance Distribution
3.1 Total Sales This Month
At the top of the Sales Overview section, the dashboard highlights total sales this month in dollars, giving a quick snapshot of revenue performance. This metric allows administrators to see how the business is performing financially in the current month without waiting for detailed reports. Tracking monthly sales in dollars makes it easier to compare periods, evaluate marketing campaigns, and set realistic goals.
3.2 Sales Contribution
Below the total sales, the dashboard breaks down performance into key areas. Each percentage represents the contribution of sales across different channels or products. The Admin Dashboards display this data clearly, helping teams understand which segments are driving revenue and which may need attention.
3.3 Product Contribution
Product performance highlights which items or categories are performing best. The Premium Admin Dashboard presents this information visually, making it easy to spot trends, identify popular products, and plan inventory or promotions effectively.
3.4 Community Contribution
Community engagement is another valuable metric within the Bootstrap Admin Template. It shows how user interaction, such as comments, reviews, and participation in discussions, contributes indirectly to sales. Understanding engagement alongside direct revenue metrics gives a fuller picture of business performance.
4. A Closer Look at Design and Layout
4.1 Organized Visual Structure
The dashboard follows a visual structure that emphasizes order and readability. Information is grouped according to purpose, making it easy to follow. Admins don’t have to hunt for data or click through layers of menus.
4.2 Responsive and Easy to Navigate
The dashboard adjusts smoothly across different devices. Whether viewed on a laptop, tablet, or phone, the experience remains consistent. This is one of the qualities that makes the Admin Dashboards reliable for teams who work on the go or across several locations.
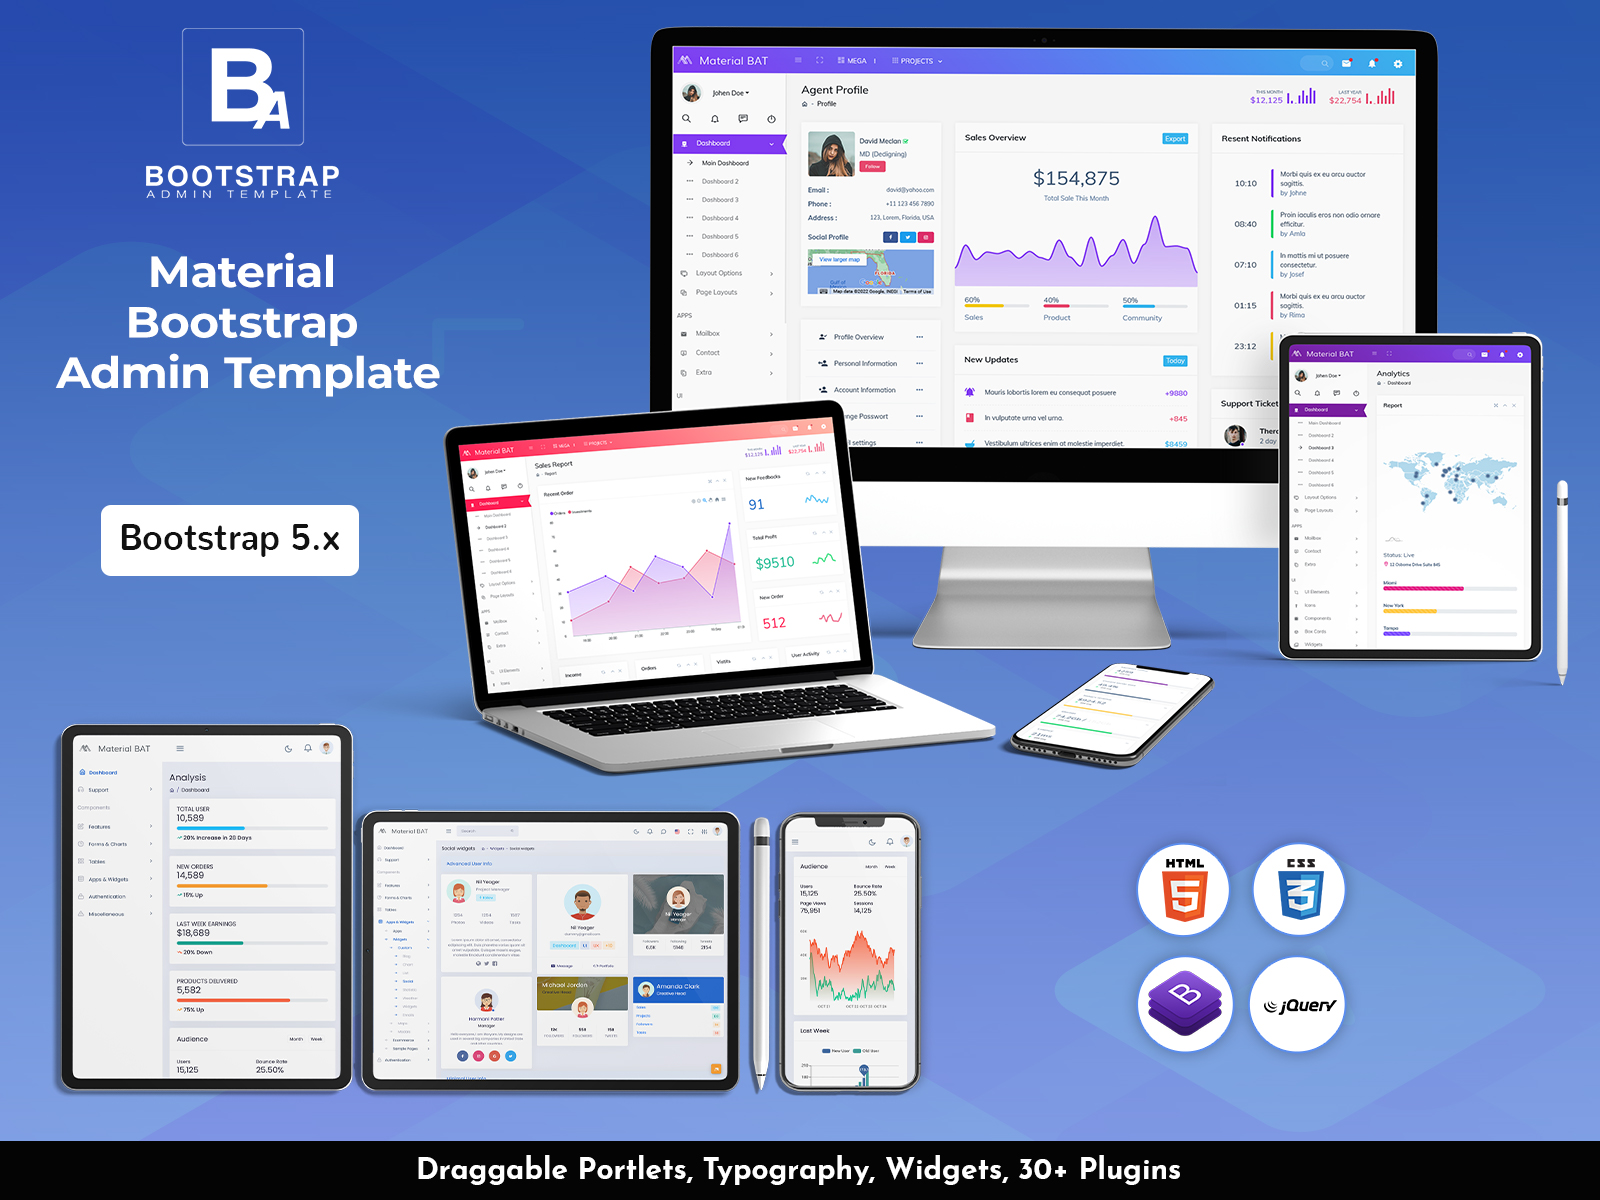
4.3 Built on Bootstrap
The foundation of this system is Bootstrap, which ensures stability, reliability, and clean design patterns. This foundation is why the Bootstrap Admin Template is trusted for projects that require both flexibility and dependability. It also makes customization easier, allowing developers to adapt the system to their needs.
5. Flexibility for Different Types of Teams
5.1 For Business Owners
Business owners can use the dashboard as a simple tool to keep track of overall performance. The Admin Template presents all metrics in a way that’s easy to understand even for those who aren’t deeply familiar with analytics or data tools.
5.2 For Managers and Team Leads
The dashboard supports planning, supervision, and strategy. Managers can rely on weekly insights, user charts, sales breakdowns, and delivery counts to make informed decisions. The arrangement of data helps team leads stay aware of performance patterns and upcoming needs.
5.3 For Developers
Because the system is built with Bootstrap and carries a clean layout, developers can expand or modify the Dashboard Admin Template to match project requirements. This adaptability is one of the reasons it fits both small and large teams.
6. Decision-Making Made Easier
6.1 Real-Time Access
The dashboard updates as data changes, allowing teams to stay aligned with current activity. This supports quick reactions to sales spikes, user surges, or operational issues.
6.2 Identifying Opportunities
With clear insights into user growth, product delivery, sales distribution, and engagement, businesses can spot areas that deserve more attention. The Premium Admin Dashboard lays out information in a way that highlights what’s working and what could be improved.
6.3 Supporting Long-Term Growth
The variety of metrics included in the dashboard helps companies prepare long-term strategies. Reliable data over time builds a strong understanding of business movement and audience behavior. The Admin Dashboards play a strong role in planning expansions, adjusting marketing efforts, and analyzing performance trends.
7. Why These Dashboards Stand Out
7.1 Straightforward and Practical
Many dashboards overload users with too many widgets or complicated graphs. This system avoids that problem by focusing only on the information that matters most. The Admin Template keeps things clean, direct, and structured for daily use.
7.2 Balanced Between Detail and Simplicity
The dashboard provides enough detail to be useful without becoming overwhelming. Charts, metrics, and percentages are displayed clearly. The Dashboard Admin Template finds a balance that fits both technical and non-technical users.
7.3 Reliable for Everyday Operations
Several teams rely on the Premium Admin Dashboard for regular monitoring. It’s consistent, stable, and built to handle ongoing business needs. Whether you’re tracking sales, reviewing product performance, or monitoring user activity, the dashboard supports your work with dependable clarity.
Conclusion
The business Analytics dashboard unifies the essential information companies need to stay informed and make confident decisions. With detailed sections dedicated to users, orders, earnings, deliveries, audience behavior, and sales contributions, the dashboard supports a complete view of performance. The blend of structure and function offered by the Admin Template ensures that teams at all levels can use the system with comfort and efficiency. Backed by the reliability of the Bootstrap Admin Template, the simplicity of the Dashboard Admin Template, and the refined layout of the Premium Admin Dashboard, this system remains practical, accessible, and ready for everyday use. Together, these Admin Dashboards create a central hub that helps teams understand their performance clearly and act quickly when needed.
Frequently Asked Questions (FAQs)
1. What is an Admin Template?
An Admin Template is a ready-made dashboard layout that shows all your important business numbers in one place. Instead of checking different reports or spreadsheets, you can see users, orders, earnings, and deliveries in a single view.
2. What KPIs does this dashboard show?
The dashboard tracks the most important numbers, like total users, new orders, weekly earnings, products delivered, bounce rate, page views, sessions, and monthly sales in dollars. These KPIs give a quick look at how your business is doing.
3. What is a Bootstrap Admin Template?
A Bootstrap Admin Template is built using the Bootstrap framework, which makes it responsive and easy to use on different devices. It also helps developers make changes or add features without breaking the design.
4. What audience data can I see in this dashboard?
The Premium Admin Dashboard shows detailed audience info, including:
- Users: How many people visited your platform
- Bounce Rate: How many left after looking at one page
- Page Views: Which pages are popular
- Sessions: How many times people visited
This helps you understand user behavior and plan improvements.
5. How does the sales overview work?
You can see total sales this month in dollars, plus how different products or channels are performing. It also shows which products are popular and how community engagement contributes to sales.
6. Who can use this dashboard?
The Admin Dashboards work for different teams:
- Business owners can get a quick overview
- Managers can plan and track performance
- Developers can customize or add features
7. Can I use it on a phone or tablet?
Yes. The Dashboard Admin Template is responsive and works on laptops, tablets, and phones. You can check important numbers from anywhere.
8. How does this dashboard help me make decisions?
By showing real-time numbers and trends, it helps you spot growth, understand what’s working, and fix problems fast. You can see what’s popular, where users are leaving, and which products are selling best.
9. Can I change how the dashboard looks or works?
Yes. The Admin Template is flexible. You can rearrange sections, add charts, or make other changes to match your team’s needs.
10. Why choose this Premium Admin Dashboard?
It’s simple, clear, and reliable. It shows the numbers that matter, keeps things easy to understand, and works for both small and big teams. It helps you focus on growth without getting lost in too much data.