Comprehensive Guide to Admin Template for Decision-Makers
In the world of full of businesses, effective Admin Template is important for success. One of the most powerful tools available for monitoring financial health and performance is the Financial Dashboard. This interactive visual display consolidates key financial metrics and data, allowing decision-makers to analyze performance, track trends, and make informed decisions.
BUY NOW
Pixel Admin Template
![]()
![]()
What is a Financial Dashboard?
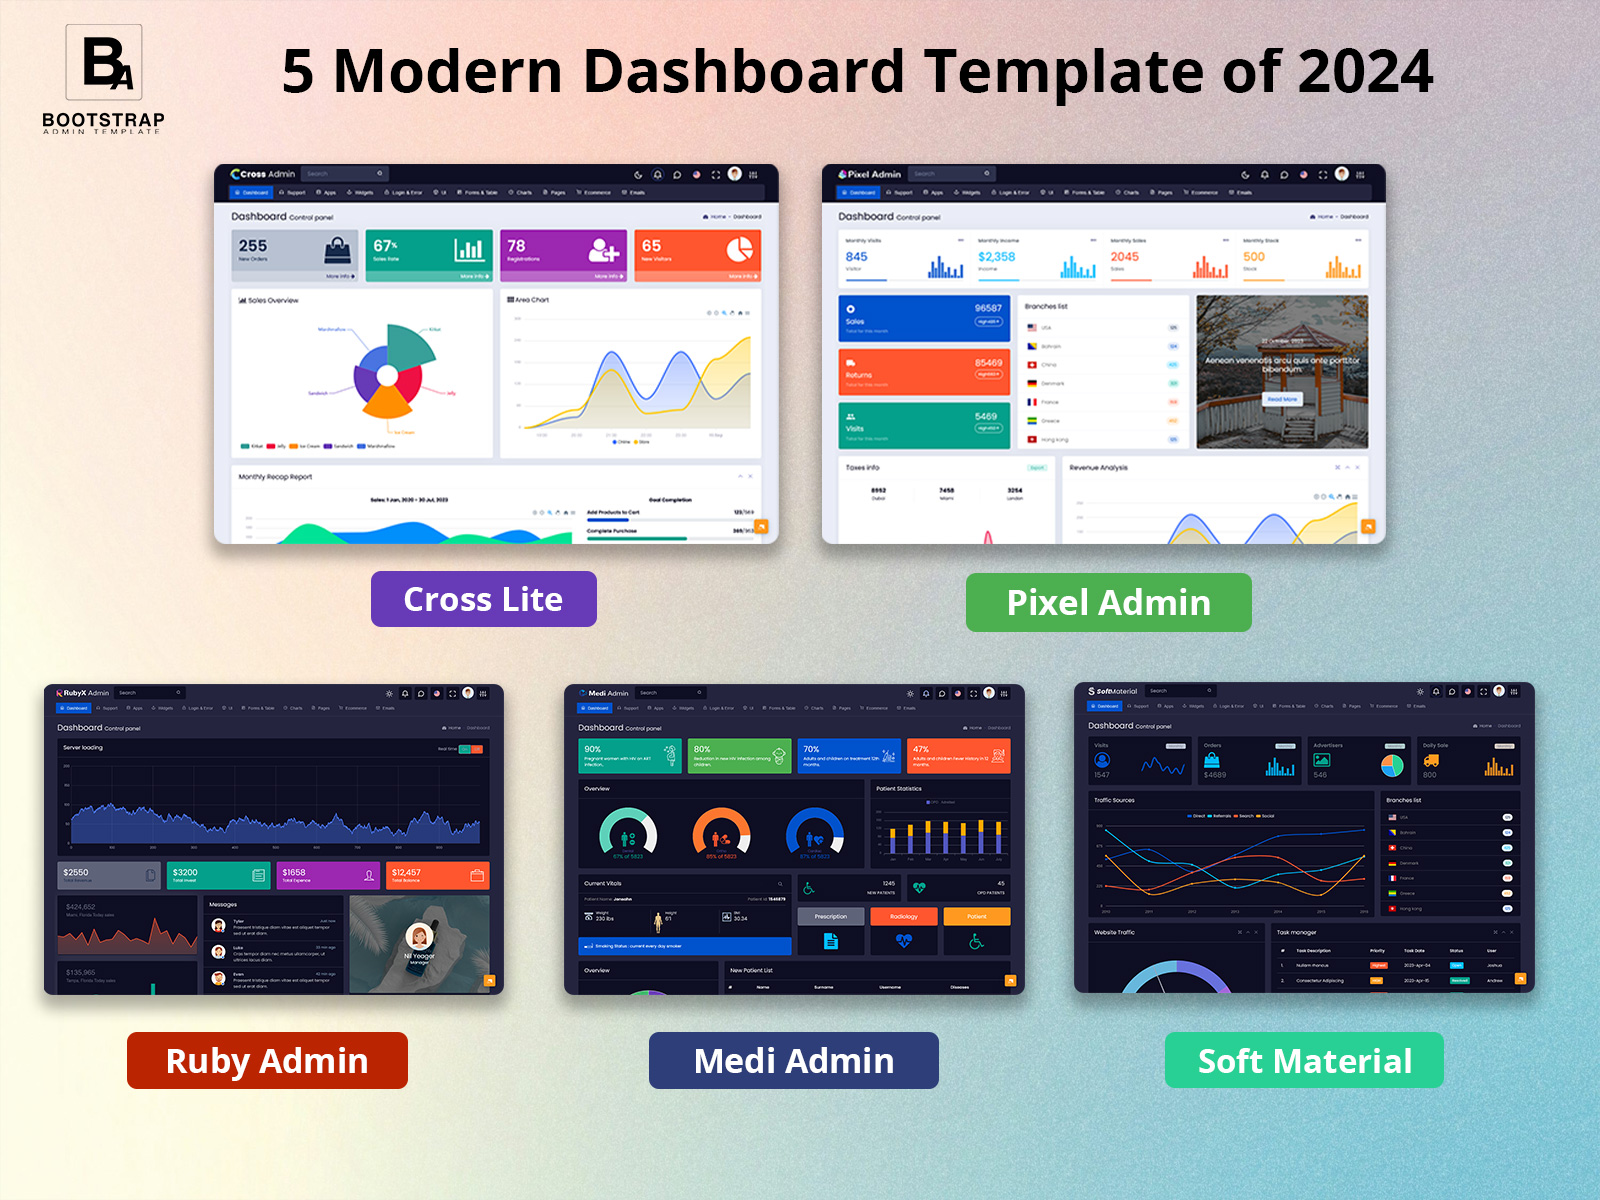
A Financial Dashboard is an analytical tool that provides a comprehensive view of a company’s financial performance. It aggregates various metrics into a single interface, enabling users to quickly assess financial health and operational efficiency. Key components of a Financial Dashboard typically include metrics such as Monthly Visits, Monthly Income, Monthly Sales, Monthly Stock, a Branches List, Sales and Returns data, Visits, Taxes Information, and Revenue Analysis.
Dashboard of Pixel Admin
MORE INFO / BUY NOW DEMO
Key Features of a Admin Template
- Monthly Visits:
– This metric tracks customer traffic to a business, either online or in-store, over a monthly time frame. Understanding visits helps businesses gauge interest in their offerings and evaluate the effectiveness of marketing strategies.
- Monthly Income:
– Displays total income generated over the month, categorized by different sources, such as product sales, services rendered, and any other revenue streams. This metric is essential for assessing financial performance and growth.
- Monthly Sales:
– Provides insights into the total sales figures for the month, often broken down by categories such as product types or regions. Analyzing monthly sales trends helps businesses identify peak sales periods and adjust inventory accordingly.
- Monthly Stock:
– Monitors inventory levels to ensure adequate supply while avoiding stockouts. This feature is crucial for maintaining operational efficiency and meeting customer demand.
- Branches List:
– Displays information about various business locations or branches, allowing for a comparative analysis of performance across different sites.
- Sales and Returns:
– Tracks both sales and product returns. This dual metric is vital for understanding customer satisfaction and product quality, as high return rates can indicate issues with products or services.
- Visits:
– Monitors website or store traffic, offering insights into customer engagement and the effectiveness of marketing campaigns. This metric can help businesses refine their outreach efforts.
- Taxes Information:
– Provides an overview of tax obligations, ensuring that businesses remain compliant with regulations. This feature helps in planning for tax payments and optimizing cash flow.
- Revenue Analysis:
– Offers insights into different revenue streams, helping businesses identify trends, measure profitability, and inform strategic planning.
Who Can Use a Financial Dashboard?
The versatility of a Bootstrap Admin Template makes it suitable for a wide range of users across various sectors. Here are some key stakeholders who benefit from using this tool:
- Business Executives:
– CEOs and other executives rely on financial dashboards to get a quick snapshot of the company’s financial health, aiding in strategic decision-making.
- Financial Analysts:
– These professionals use the Dashboard Template to dive deep into financial metrics, performing analyses that help forecast future performance and identify areas for improvement.
- Accountants:
– Accountants can utilize financial dashboards to track income, expenses, and tax obligations, ensuring accurate financial reporting and compliance.
- Sales Managers:
– Sales teams use the dashboard to monitor sales performance, analyze trends, and assess the effectiveness of sales strategies.
- Marketing Teams:
– Marketing professionals can track monthly visits and engagement metrics to evaluate campaign effectiveness and make data-driven decisions for future promotions.
- Operations Managers:
– These managers can use the dashboard to monitor stock levels, manage inventory efficiently, and ensure that operational processes align with financial goals.
Benefits of Using a Financial Dashboard
- Centralized Data Management:
– A Dashboard Template consolidates various metrics into one location, simplifying data management. Users can access all necessary financial information in a single interface, reducing the time spent searching for data.
- Real-Time Insights:
– With live data updates, financial dashboards provide real-time insights into business performance. This capability allows organizations to respond quickly to changing market conditions or operational challenges.
- Data Visualization:
– The use of graphs, charts, and tables makes complex financial data more digestible. Data visualization helps users easily identify trends and outliers, facilitating quicker decision-making.
- Improved Decision-Making:
– By providing a comprehensive view of key financial metrics, financial dashboards enable stakeholders to make informed decisions based on data rather than assumptions or intuition.
- Enhanced Collaboration:
– Financial dashboards can be shared across departments, fostering collaboration among teams. Everyone has access to the same data, ensuring alignment in objectives and strategies.
- Increased Accountability:
– With transparent metrics displayed, team members can be held accountable for their contributions to overall performance. This transparency encourages a culture of responsibility and high performance.
- Customizable Experience:
– Users can tailor the Dashboard Template to focus on metrics that are most relevant to them, enhancing usability and relevance. Customization ensures that stakeholders can quickly find the information they need.
- Historical Analysis:
– Financial dashboards often include historical data, allowing users to compare current metrics with past performance. This feature provides valuable context for evaluating success and planning for the future.
- Proactive Management:
– By continuously monitoring key metrics, businesses can identify potential issues before they escalate. This proactive approach can save organizations from costly mistakes and inefficiencies.
Conclusion
An Admin Template is an essential tool for any organization aiming to enhance its financial management and operational insights. With features that aggregate critical metrics into a cohesive view, this dashboard empowers users to monitor performance, identify trends, and make informed decisions.
From executives to marketing teams, the versatility of the Admin Template makes it a vital component in the toolkit for driving success. By centralizing data and providing real-time insights, businesses can navigate the complexities of financial management and position themselves for growth in an ever-evolving market landscape.

I’ve been using this admin template for a few months now, and it has completely transformed how I manage my clients, products, and sales. The dashboard is intuitive, and I love how easy it is to track invoices and sales data. Highly recommend!
This bootstrap admin template has made managing my small business so much easier. From client management to tracking yearly sales, it’s all in one place. It’s simple to use and saves me so much time. Definitely worth the investment!
As a growing company, we needed a solution to manage our client relationships and track product performance. This dashboard template has done just that and more. It’s user-friendly, and our team can access the data they need quickly, which has improved our overall efficiency.
We used to juggle multiple tools to manage clients, products, and invoices. This admin template brings everything together seamlessly. The ability to monitor sales performance in real time is a game changer. It’s perfect for streamlining daily operations.
I was looking for a tool that would help me track sales and manage clients with minimal effort, and this bootstrap admin template delivers. It’s easy to navigate, and the customizable features let me tailor it to our business needs. It has all the features we need, and then some.
For any business looking to scale up, this dashboard template is essential. The comprehensive features allow us to track everything from sales performance to client interactions. I particularly love the analysis feature, which helps me make data-driven decisions.
This admin template is a time-saver! No more manually inputting data or tracking sales through spreadsheets. Everything is integrated, and the real-time updates ensure accuracy. It’s perfect for businesses that need to keep things running smoothly without a lot of effort.
As an e-commerce business owner, managing inventory and sales data is crucial. This bootstrap admin template lets me keep track of all my products and monitor their performance year over year. It’s easy to update and very detailed, making inventory management so much simpler.
I love how customizable this dashboard template is. Whether you’re a freelancer or running a large business, you can adjust it to fit your needs. The interface is clean, and navigating through different sections is a breeze. It’s definitely a great tool for business management.
This admin template has everything I need to manage my business in one place—client info, invoices, sales reports, and more. It’s the perfect all-in-one solution. The best part is that it’s incredibly easy to use, even for someone with no tech background. Highly recommend to others!