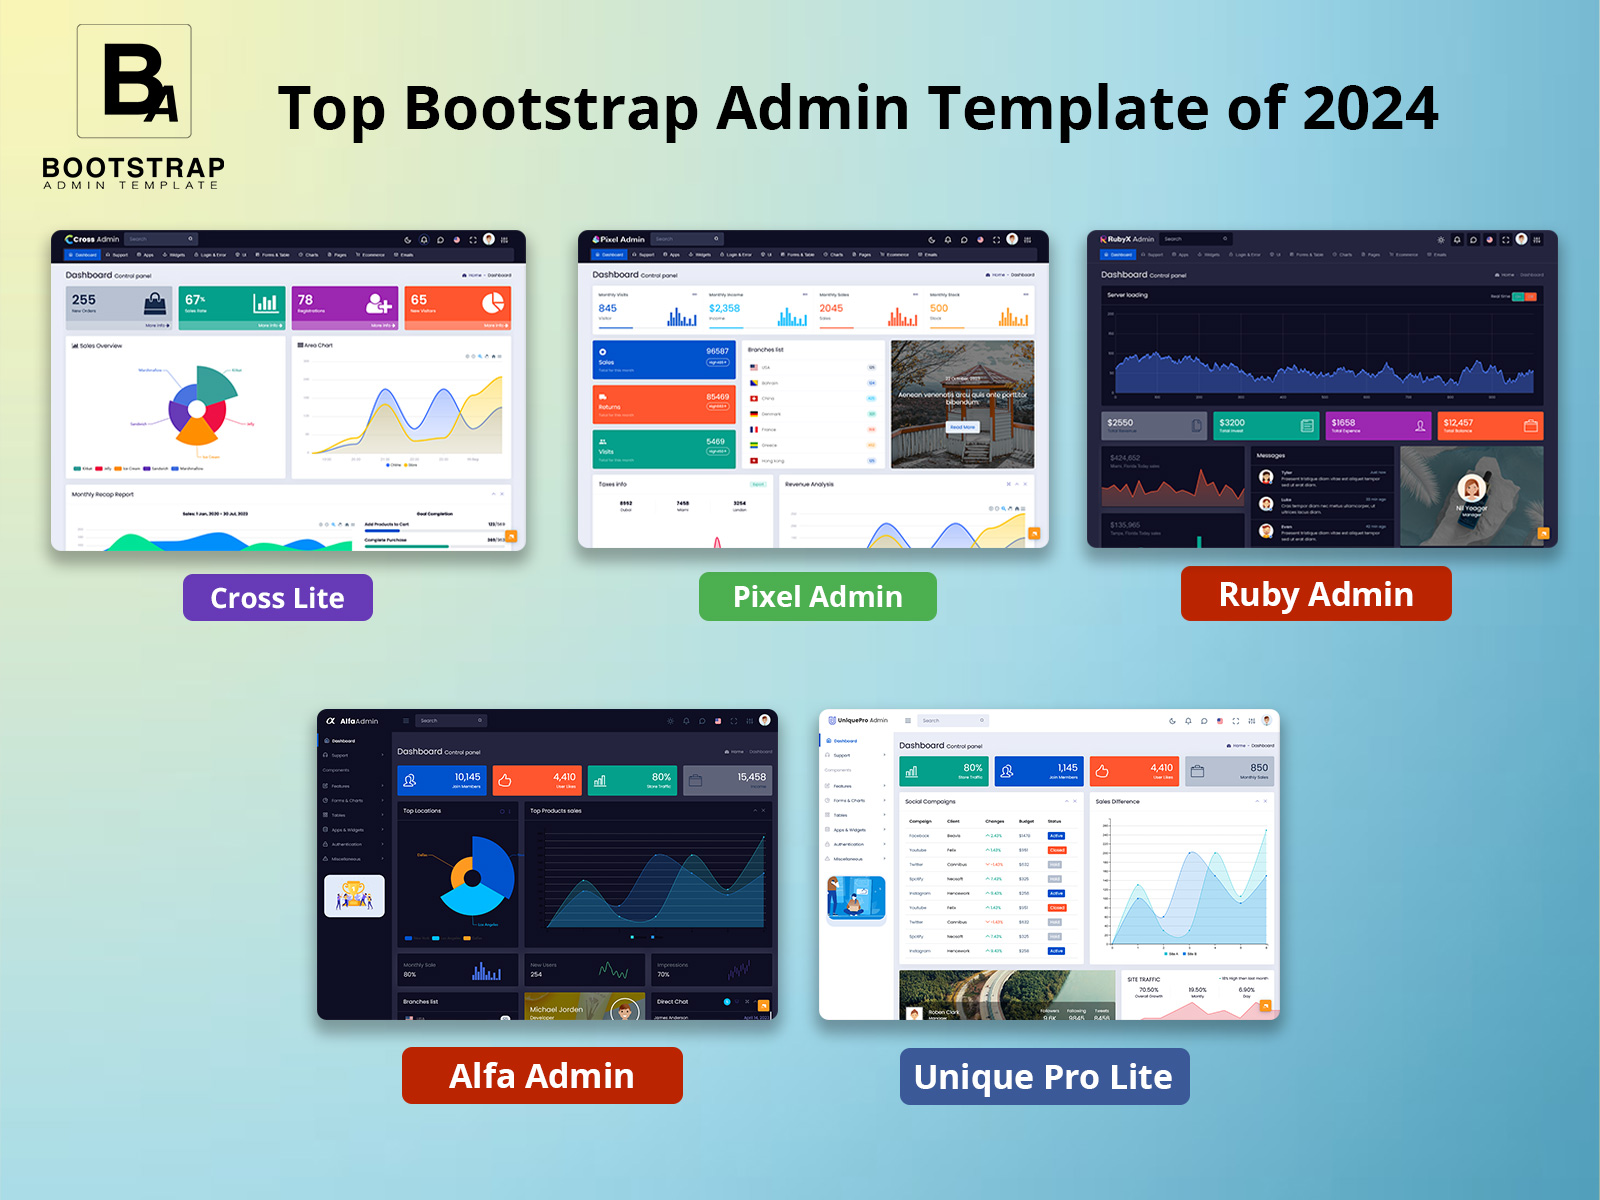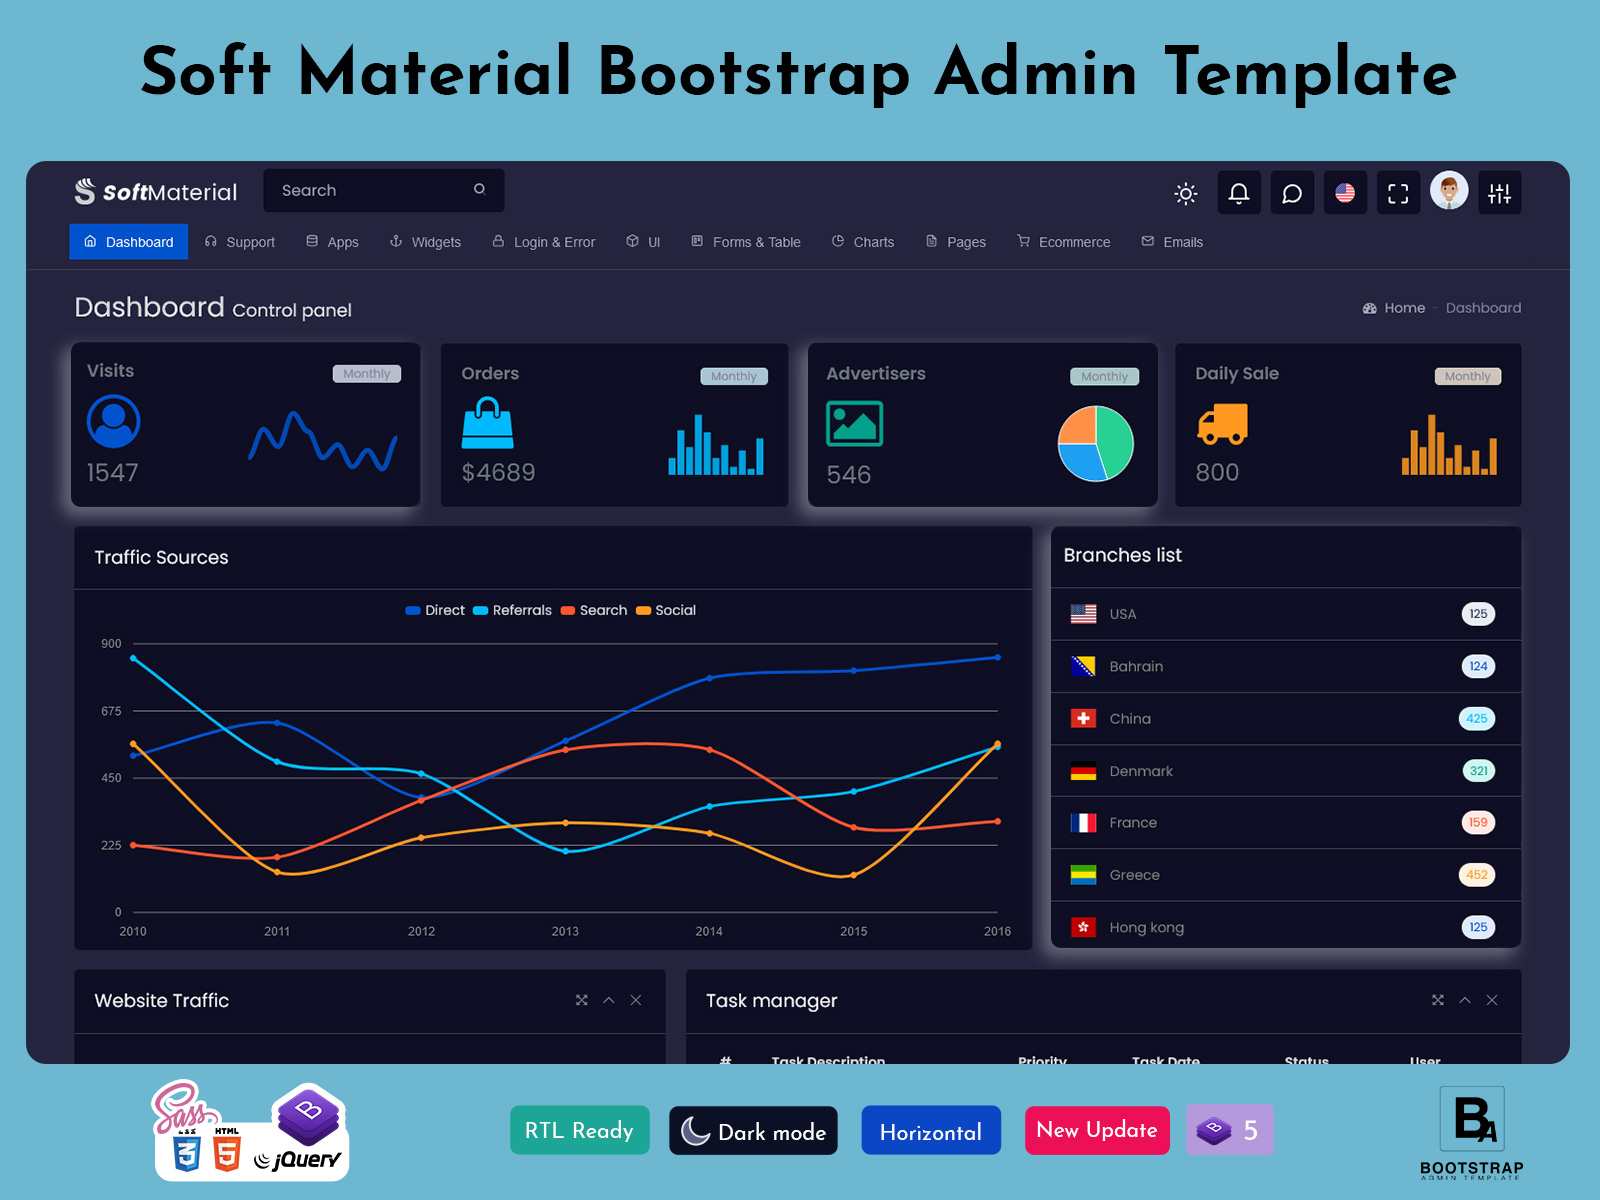
Innovating Interactive Dashboard Template for Deeper Analysis
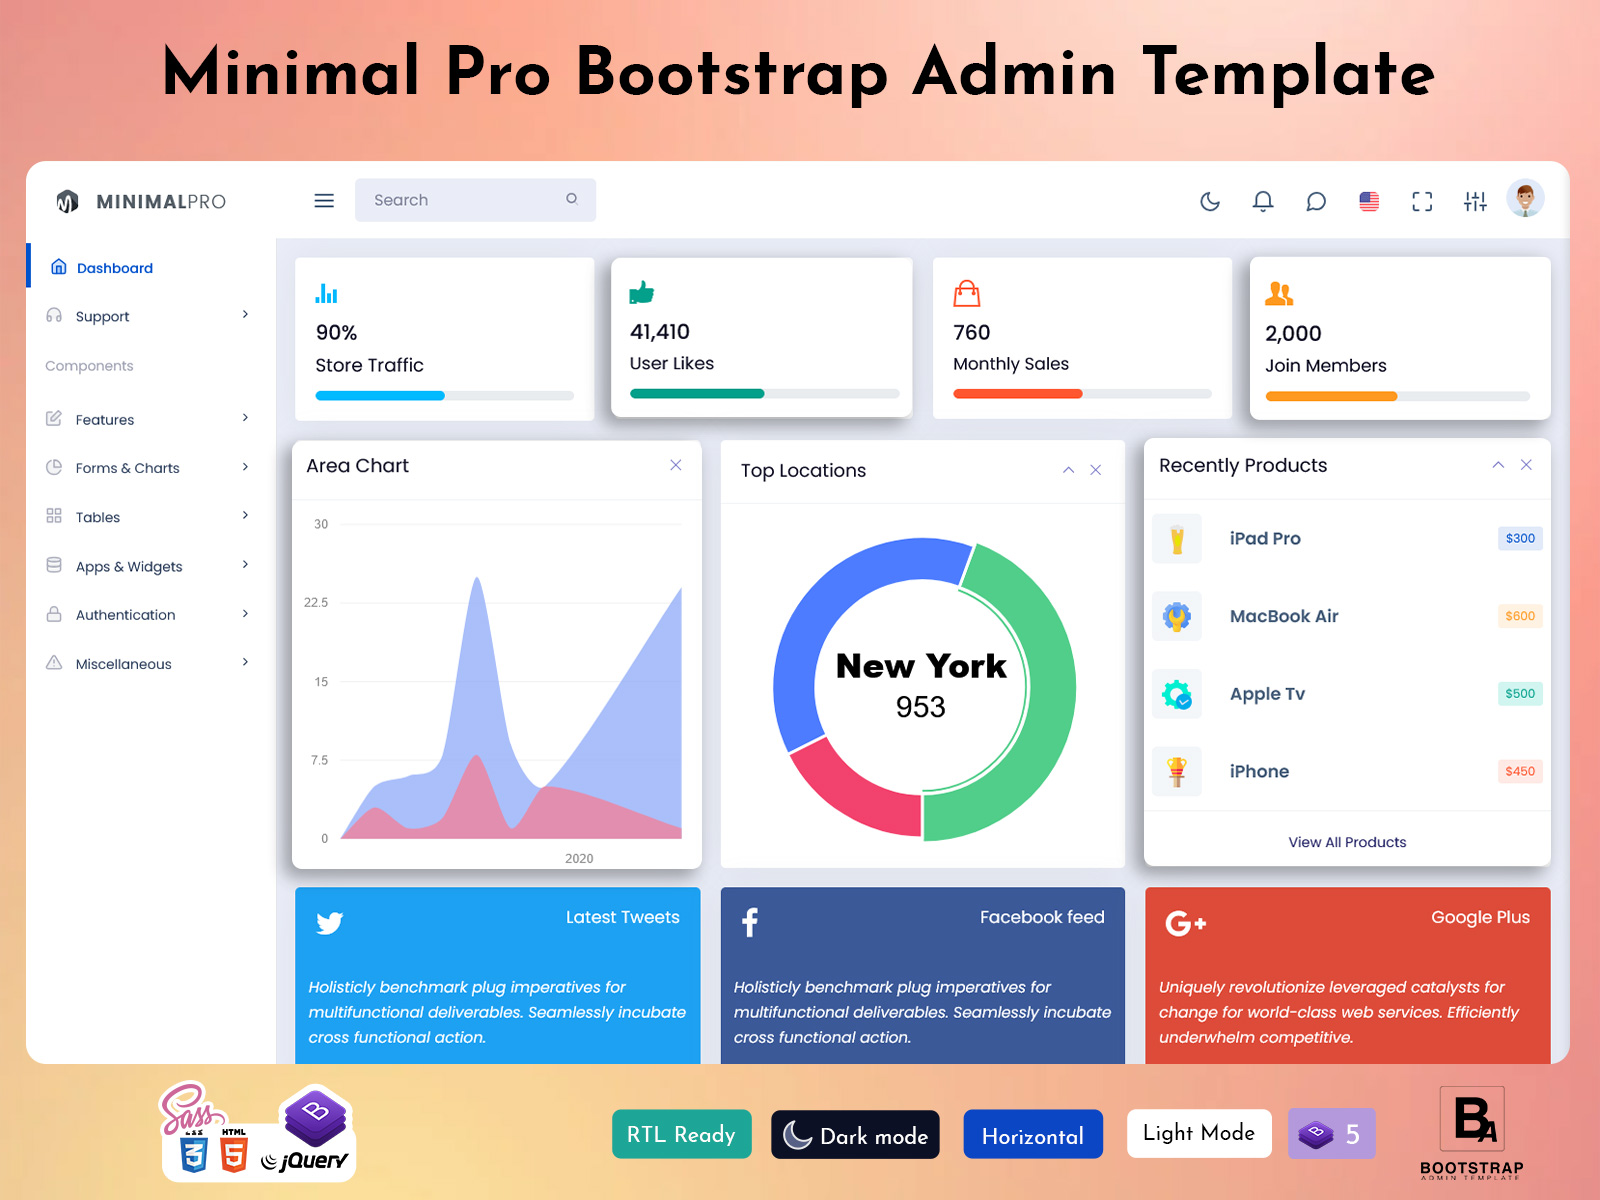
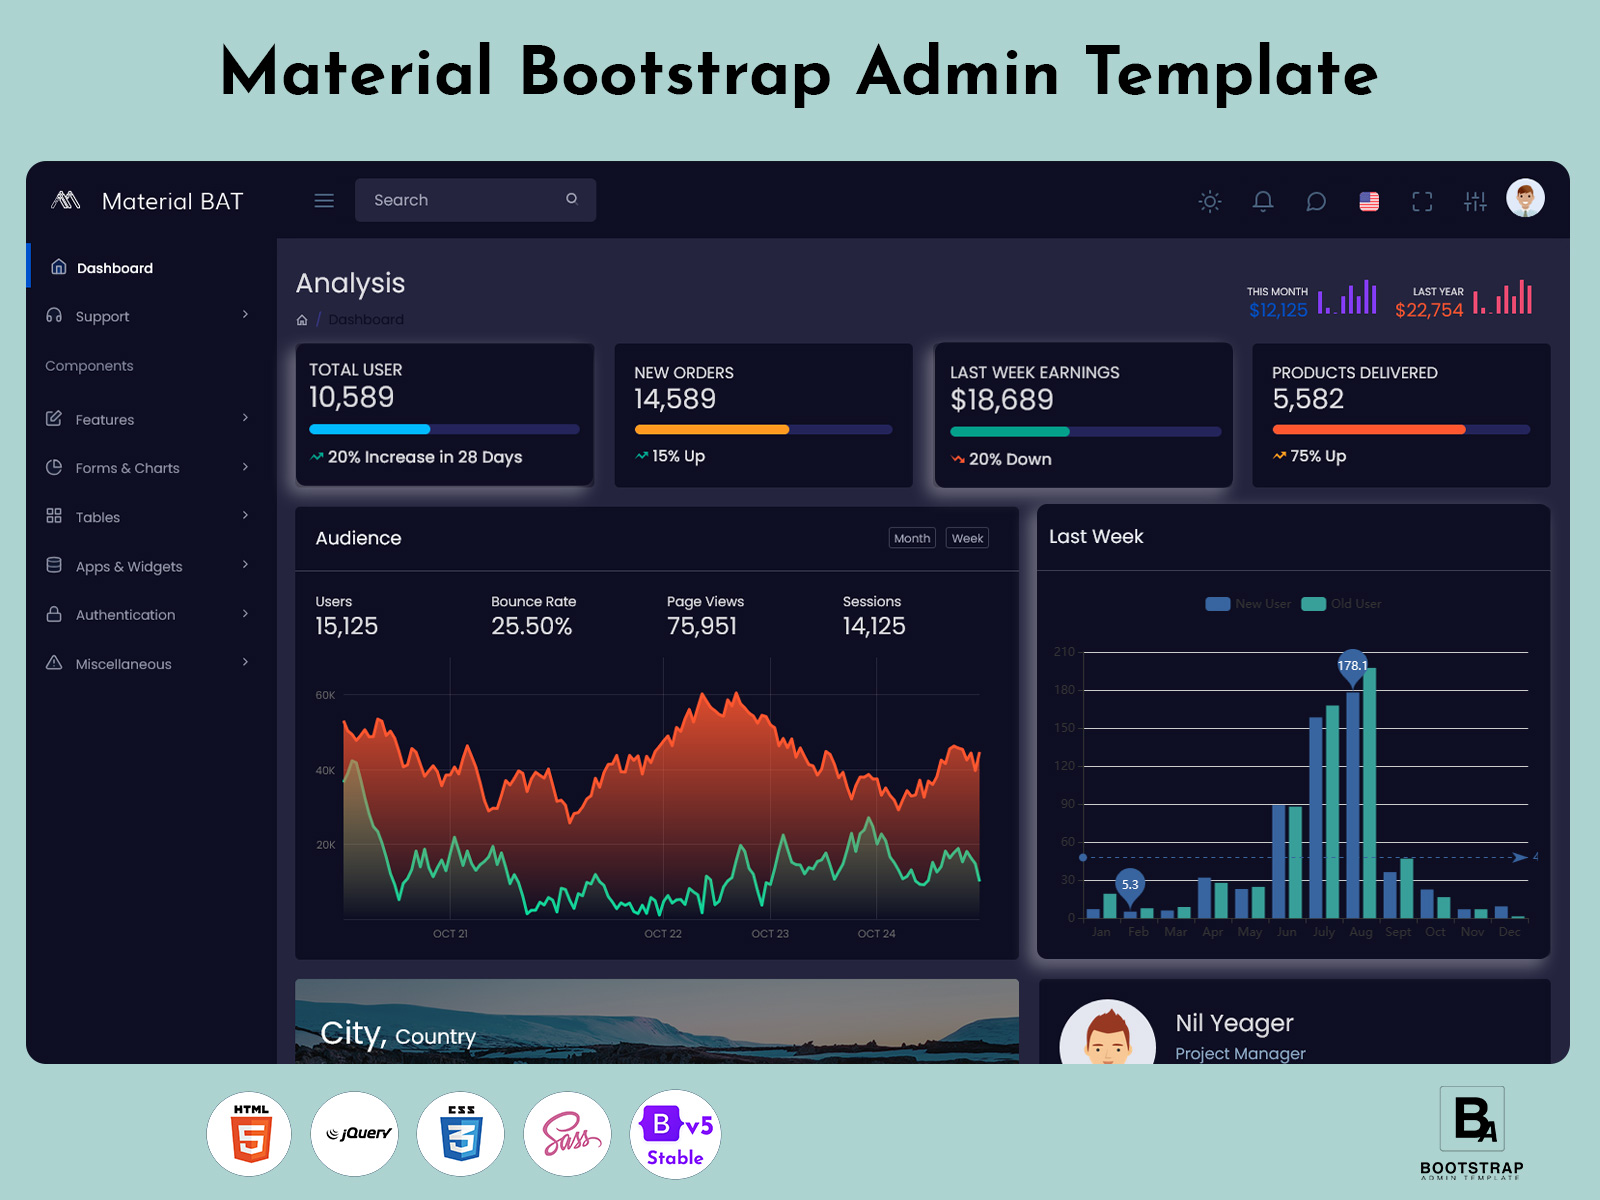
Businesses collect a lot of data and need effective tools to understand it. One helpful tool is an interactive dashboard template. These dashboards let users see and analyze data clearly, making it easy to take action. Interactive dashboard templates can show various types of data in one place, allowing users to spot trends and patterns easily. With features like charts, graphs, and maps, these dashboards turn complex information into something simple and understandable.
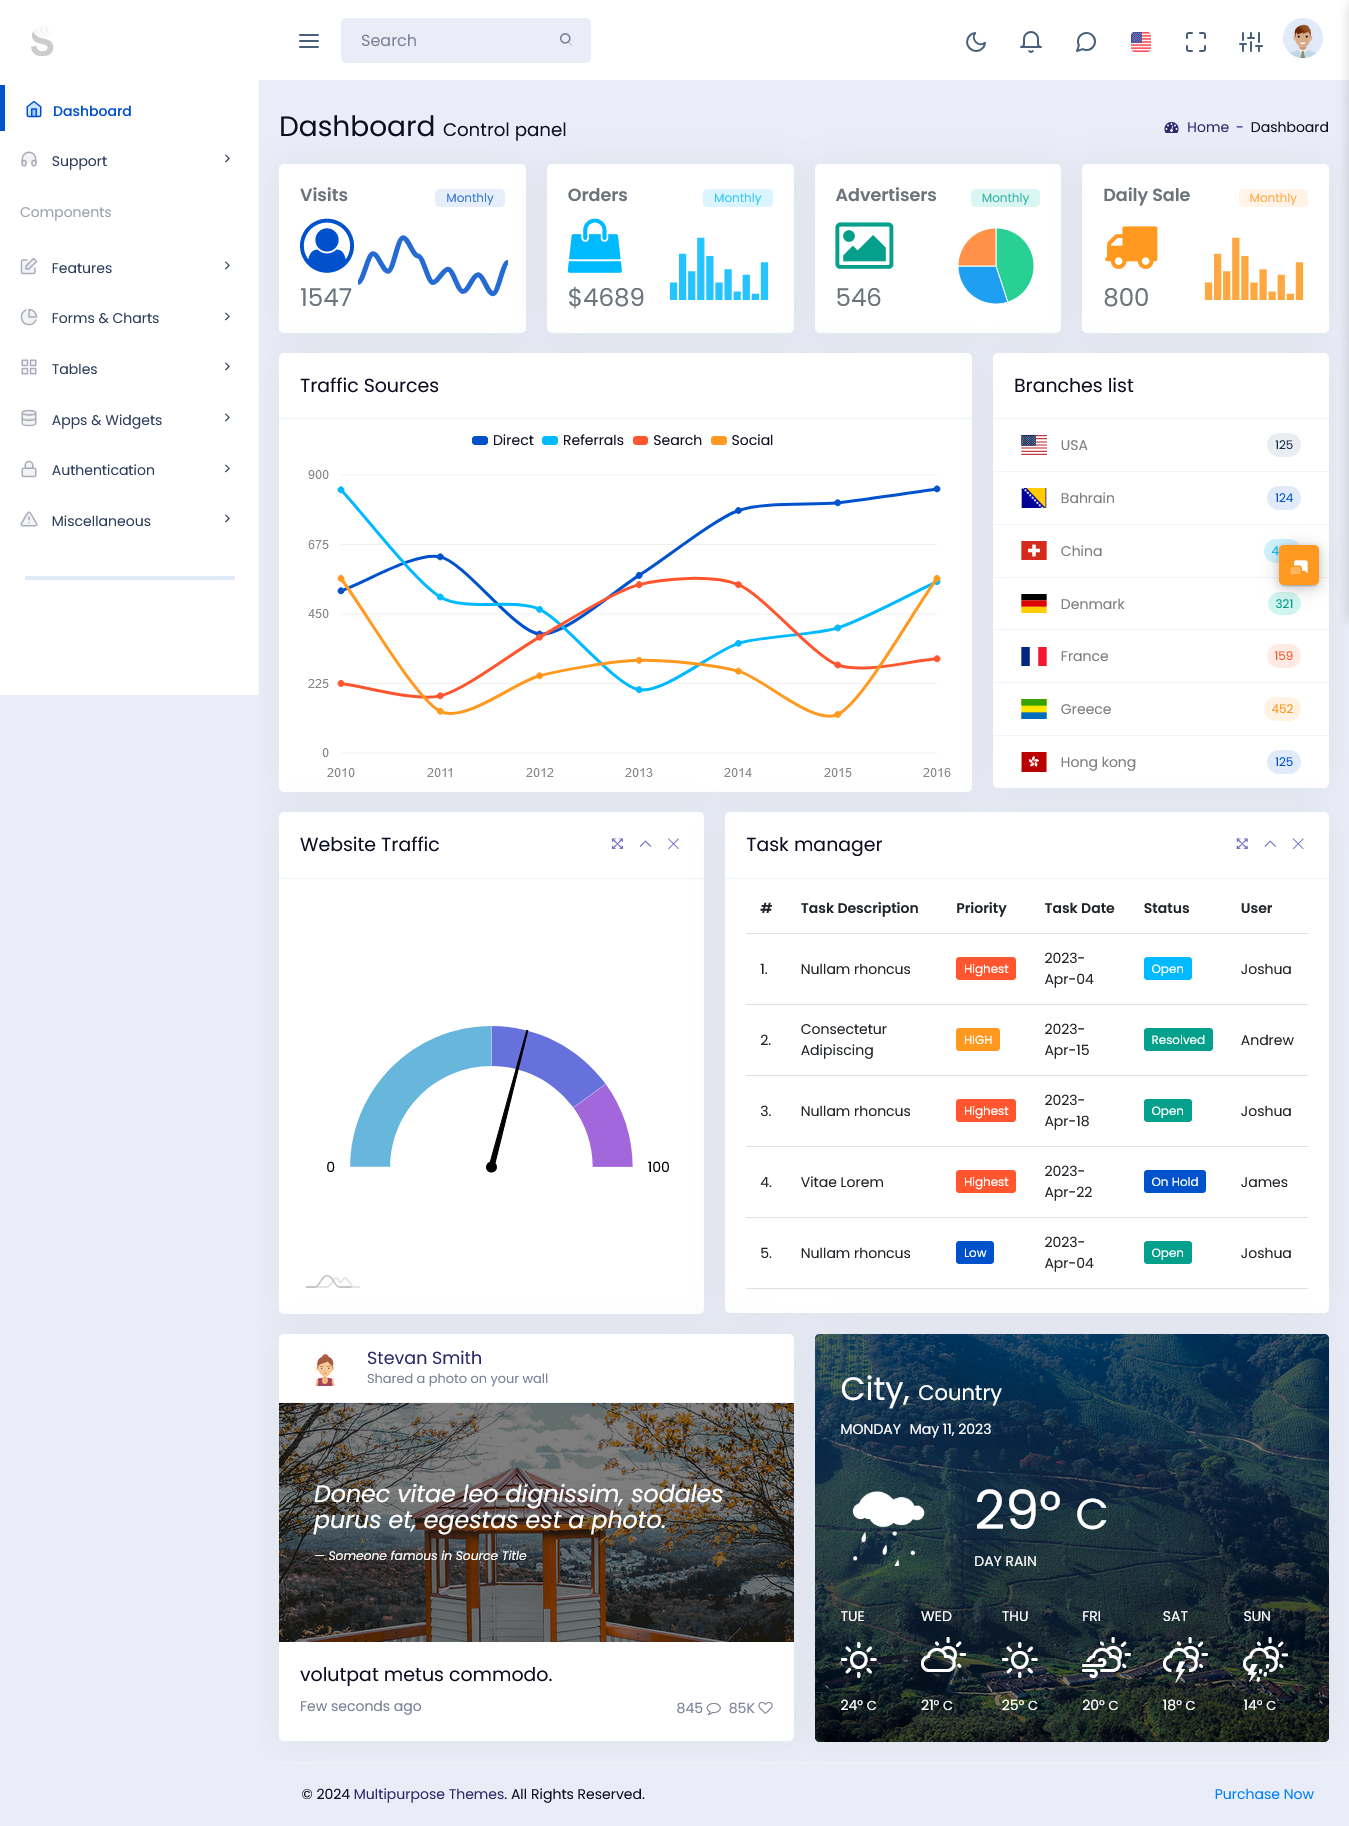
Main Dashboard – Light
MORE INFO / BUY NOW DEMO
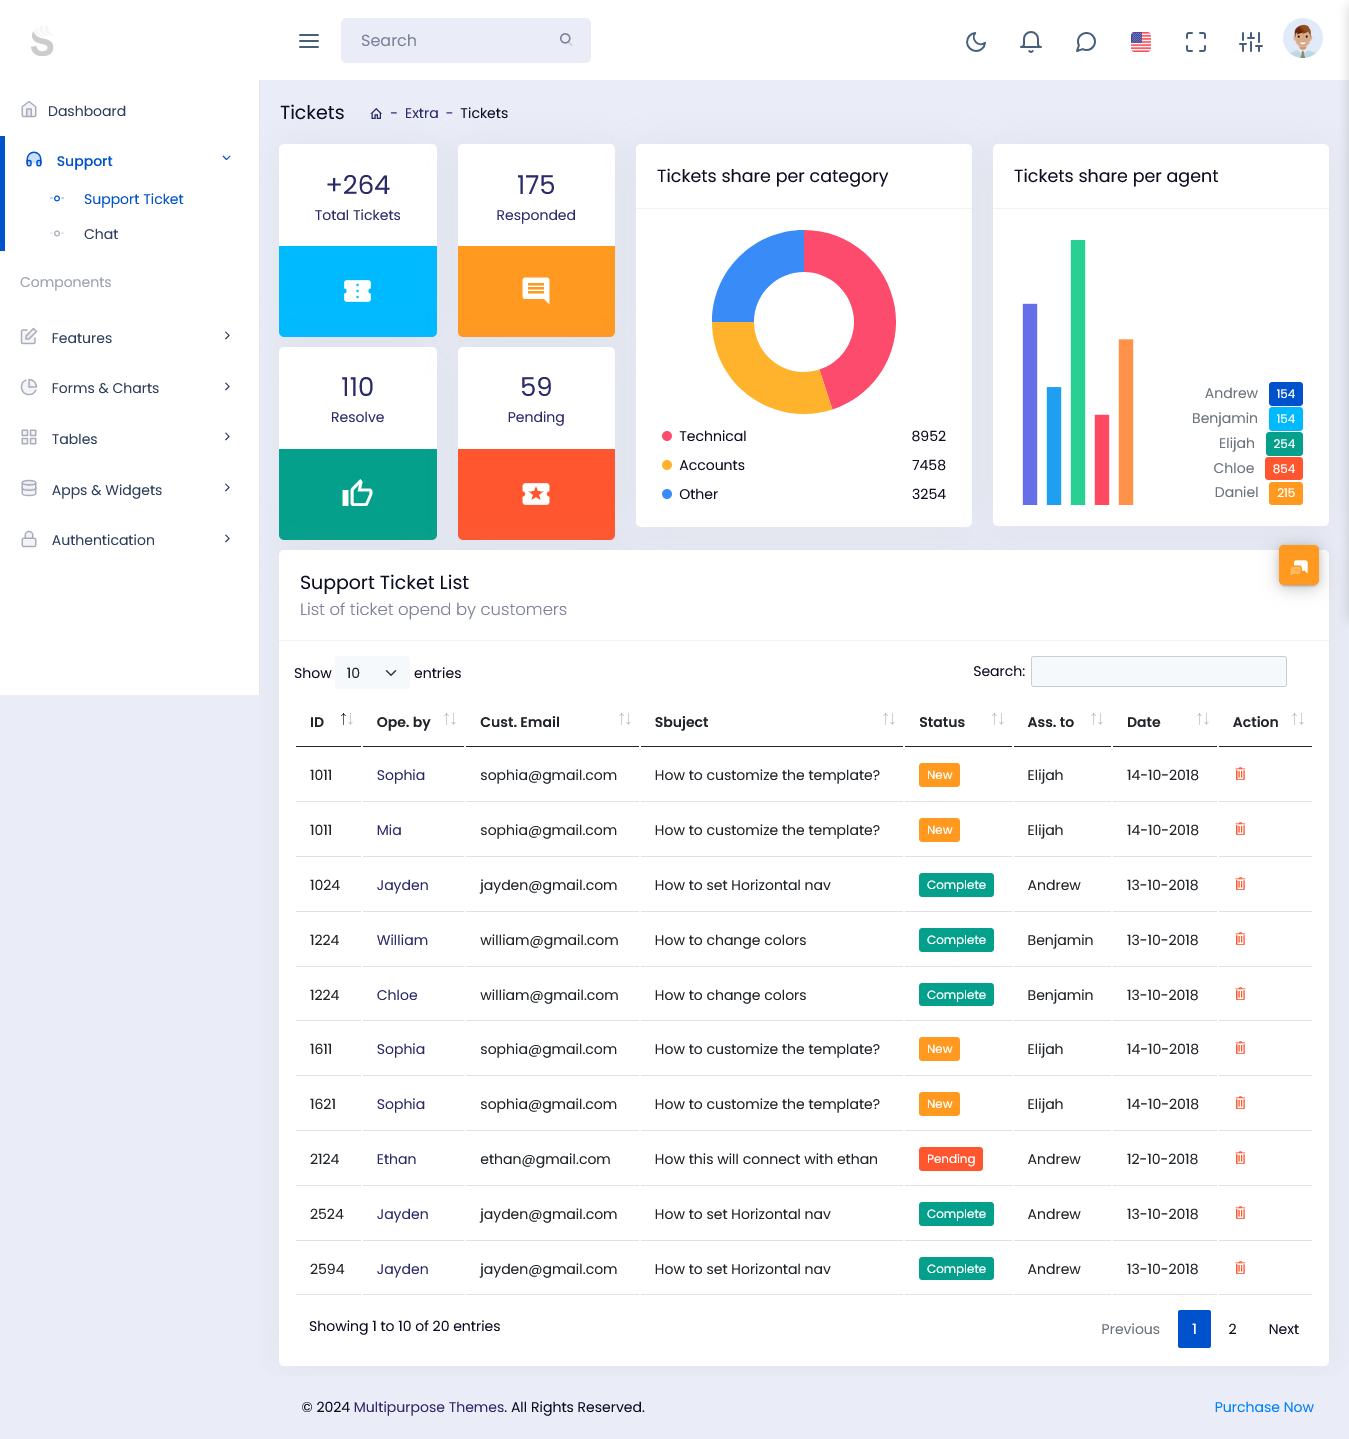
Chat App Page
MORE INFO / BUY NOW DEMO
What is an Interactive Dashboard Template?
An interactive dashboard template is a visual representation of data that allows users to interact with the information displayed. Instead of simply viewing static charts or graphs, users can manipulate the data in real time. This interaction can involve filtering data, drilling down into specifics, or even changing the visual representation to see different insights.
Key Features of Interactive Dashboards
Real-Time Data Updates: Interactive dashboards often pull data from various sources, updating in real time. This ensures that users always have access to the most current information.
User-Friendly Interface: A well-designed admin template is intuitive. Users can easily navigate through different data sets without needing extensive training.
Customization Options: Users can often customize their dashboards to display the metrics that matter most to them, allowing for a tailored experience.
Visualizations: Effective dashboards use various visual elements—charts, graphs, and maps—to represent data clearly and engagingly.
Interactive Elements: Features like drop-down menus, sliders, and clickable charts enable users to explore data at different levels.
Benefits of Using Interactive Dashboard Templates
Interactive dashboards provide several advantages, making them essential for modern businesses:
- Enhanced Data Visualization
Interactive dashboards transform complex data sets into visual formats that are easier to digest. By presenting data visually, users can quickly identify trends, patterns, and outliers that may not be apparent in raw data.
- Improved Decision-Making
With access to real-time data and visual analytics, decision-makers can act swiftly and confidently. Interactive dashboards allow teams to analyze various scenarios and outcomes, leading to more informed decisions.
- Increased Engagement
Traditional reports can be dull and unengaging. Interactive dashboards, on the other hand, invite users to explore and interact with the data. This increased engagement can lead to better understanding and retention of information.
- Collaboration Opportunities
Interactive dashboards can be shared across teams, promoting collaboration. Team members can view the same data, discuss insights, and work together on strategies based on the information presented.
- Accessibility
Many interactive dashboard tools are cloud-based, making them accessible from anywhere. This is especially useful for remote teams who need to stay informed and aligned.
Innovating Interactive Dashboard Templates
While interactive dashboards already offer numerous benefits, there are ways to innovate them further for deeper analysis. Here are some strategies:
- Integrating Advanced Analytics
By incorporating advanced analytics tools, such as predictive modeling or machine learning, dashboard templates can provide deeper insights. For example, a sales dashboard might analyze past sales data to forecast future trends, allowing businesses to prepare accordingly.
- Enhancing User Experience
User experience is crucial for the effectiveness of an interactive dashboard template. Innovations like voice commands, natural language processing, and AI-driven insights can make dashboards even more user-friendly. Imagine asking your dashboard, “What were our top-performing products last month?” and getting instant visual results.
- Adding Contextual Data
Incorporating contextual data can help users understand the bigger picture. For instance, if a business sees a drop in sales, additional data on market trends or customer feedback can provide valuable context for analysis.
- Mobile Optimization
With the rise of remote work and mobile devices, ensuring that dashboards are mobile-friendly is essential. An innovative bootstrap admin template should provide a seamless experience across devices, allowing users to access insights anytime, anywhere.
- Customizable Alerts
Setting up alerts for key performance indicators (KPIs) can help businesses stay proactive. An innovative dashboard could allow users to customize alerts based on specific criteria, ensuring they are notified of important changes or trends as they happen.
- Collaborative Features
Integrating collaborative tools within the dashboard can enhance teamwork. Features like shared notes, comments, or the ability to create action items directly from the dashboard can streamline communication and decision-making.
Best Practices for Using Interactive Dashboards
To make the most of interactive dashboards, consider these best practices:
- Define Clear Objectives
Before creating a dashboard, it’s essential to define its purpose. What questions do you want to answer? What metrics are most important? Having clear objectives will guide the design and functionality of the dashboard.
- Keep It Simple
While it might be tempting to include every possible data point, simplicity is key. Focus on the most relevant metrics and ensure the design is clean and uncluttered. A simple layout enhances usability and comprehension.
- Use Consistent Visuals
Maintaining consistency in colors, fonts, and chart types helps users navigate the dashboard more easily. Consistent visuals create a professional look and make it easier to compare data.
- Test and Iterate
Once your Admin Template is live, gather feedback from users. Are they finding it useful? Are there features they wish they had? Use this feedback to make improvements and enhance functionality.
- Train Users
Ensure that all potential users are trained on how to use the dashboard effectively. Offering training sessions or resources can help team members feel comfortable and confident in navigating the tool.
Conclusion
Innovating interactive dashboard template is crucial for businesses looking to leverage data for deeper analysis. By enhancing visualization, improving user experience, and incorporating advanced analytics, organizations can gain valuable insights that drive decision-making. As the business landscape continues to evolve, adopting and innovating interactive dashboards will remain a key strategy for success. Embrace these tools to empower your team and make informed choices that propel your business forward.

